What Are Claim Denials? Causes, Types & How to Reduce Them (2026)
The Qualigenix Editorial Team consists of certified billing and coding experts with over 40 years of experience across 38+ medical specialties. Our content is rigorously researched against CMS, AMA, and payer-specific guidelines to ensure total compliance and accuracy. We apply the same elite standards to our resources as we do our client work, consistently delivering high claim accuracy and significant reductions in AR days.
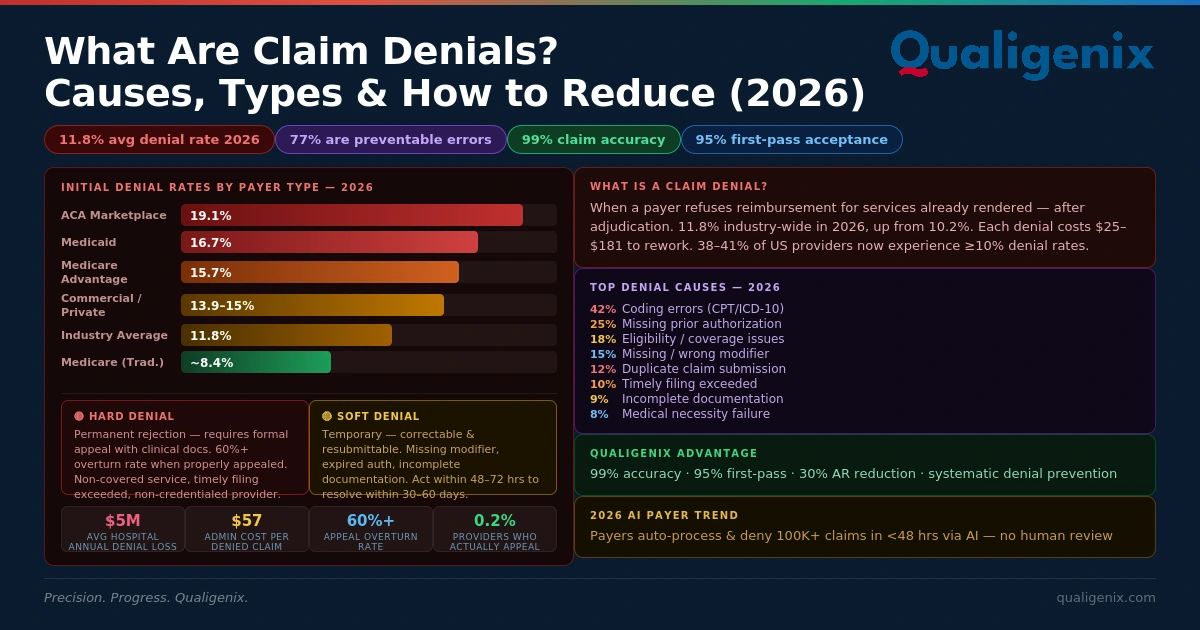
Claim denials happen when a payer refuses to reimburse a provider for services already rendered — either permanently (hard denial) or temporarily (soft denial). In 2026, initial denial rates average 11.8% industry-wide, up from 10.2% just a few years ago. Each denied claim costs $25–$181 to rework. Hospitals lose $5 million annually to denials on average. Three in four ACA plan denials stem from administrative errors — not medical necessity disputes — meaning the vast majority are preventable. The practices that hold denial rates below 5% do one thing differently: they fix the process, not just the claim.
Claim denials are the most persistent revenue leak in medical billing. Not fraud. Not underpayments. Not contract disputes. Denials. Every day, across every specialty and every payer type in the US, billions of dollars in earned revenue sit in denial status — waiting to be reworked, appealed, or written off entirely.
The numbers in 2026 are striking. Initial denial rates hit 11.8% industry-wide (OS Healthcare, 2026). Medicare Advantage plans denied 15.7% of initial claims. Medicaid denied 16.7%. ACA marketplace plans denied 19.1% of in-network claims — nearly one in five. And 38–41% of providers now experience denial rates at or above 10% (Experian Health, 2025). Commercial payers have ramped up AI-powered claims review, with reports of automated systems processing — and denying — hundreds of thousands of claims in under two months.
The cost is not just the denied dollar. It is the staff hours spent reworking the claim, the 30–60 additional days before reimbursement arrives, and the percentage of denials that are never successfully appealed or resubmitted. The administrative cost per denied claim rose to $57.23 in 2023, up from $43.84 the year before (Aptarro, 2026). Hospitals lose an average of $5 million annually to denials — 5% of net patient revenue (Journal of AHIMA). For physician practices running on thin margins, a denial rate above 10% compounds quietly into a financial crisis.
This guide covers what claim denials are, the difference between hard and soft denials, the 10 most common causes, denial rates by payer, the real financial math of denied claims, what is driving denial growth in 2026, and a systematic prevention strategy — including how Qualigenix denial management services achieve 95% first-pass acceptance and a 30% reduction in AR days.
What Are Claim Denials in Medical Billing?
A claim denial occurs when a health insurance payer — Medicare, Medicaid, or a commercial insurer — refuses to reimburse a healthcare provider for services already rendered. Denials can be full (entire claim rejected) or partial (specific line items rejected). They happen after adjudication, when the payer has reviewed the claim and determined it does not meet coverage criteria, documentation requirements, or billing rules. In 2026, the average initial claim denial rate across all payer types is approximately 11.8%.
Every provider who bills insurance will encounter claim denials — it is not a question of if but how many and for what reasons. The critical question is whether those denials are preventable, recoverable, or lost. Most practices operate with a mixed picture: some denials are soft denials from correctable administrative errors, some are hard denials from non-covered services, and some represent systematic coding or documentation problems that will recur indefinitely unless the root cause is identified and fixed upstream.
Understanding the difference between a rejection and a denial is the first step. A claim rejection happens before adjudication — the clearinghouse or payer’s front-end system finds a technical error (missing field, invalid code format, wrong NPI) and kicks the claim back without processing it. A rejection is not a denial; it is a submission failure. A claim denial happens after the payer adjudicates the claim — the claim was received, processed, and reviewed, but the payer determined it does not qualify for payment. Rejections are corrected at the submission level; denials require appeals with supporting documentation.
Claim Denials: Key Statistics and Benchmarks 2026
| Metric | Value / Benchmark |
|---|---|
| Industry-wide initial claim denial rate (2024) | 11.8% — up from 10.2% in recent prior years (OS Healthcare, 2026) |
| Providers experiencing ≥10% denial rates | 38–41% of all US providers (Experian Health, 2025) |
| Medicare initial denial rate | ~8.4% — lowest among major payer types |
| Medicaid initial denial rate | ~16.7% — highest among major payer types |
| Medicare Advantage initial denial rate | ~15.7% (Health Affairs, 2026) |
| Commercial / private payer initial denial rate | ~13.9–15% (Premier Inc. survey) |
| ACA marketplace in-network claim denial rate (2024) | 19.1% — nearly 1 in 5 in-network claims denied (MoneyGeek, 2026) |
| ACA denied claims total (2023) | ~49 million denied in-network claims across marketplace plans |
| Administrative cost per denied claim (2023) | $57.23 — up from $43.84 in 2022 (Aptarro, 2026) |
| Rework cost per denied claim | $25–$181 in staff time per claim |
| Average hospital annual loss from denials | $5 million — 5% of net patient revenue (Journal of AHIMA) |
| Denials from administrative / paperwork errors | 77% — three in four denials not medical necessity disputes (MoneyGeek, 2026) |
| Private payer appeal overturn rate | 60%+ when appealed (Premier Inc.) |
| Medicare Advantage appeal overturn rate | ~53% |
| Providers who actually appeal denied ACA claims | Fewer than 0.2% (MoneyGeek, 2026) |
| Coding errors as a share of all denials | ~42% (Sully.ai, 2026) |
| Qualigenix claim accuracy rate | 99% — across all payer types and specialties |
| Qualigenix first-pass acceptance rate | 95% — with integrated pre-submission scrubbing and denial management |
| Qualigenix AR days reduction | 30% average — faster first-pass = less denial rework = faster cash |
What Is the Difference Between Hard Denials and Soft Denials?
Every denial your billing team receives falls into one of two categories. The category determines what you can do with it — and how fast you need to act.
🔴 Hard Denial
Definition: A permanent, final rejection. The payer has determined the claim does not qualify for reimbursement and the decision stands unless successfully appealed through a formal dispute process.
Recovery path: Formal appeal with clinical documentation, peer-to-peer review, or external review. Commercial payers overturn 60%+ of appealed denials when properly appealed.
Common examples:
- Non-covered service or excluded benefit
- Medical necessity dispute
- Experimental or investigational procedure
- Service rendered by non-credentialed provider
- Timely filing limit exceeded
🟡 Soft Denial
Definition: A temporary rejection that can be corrected and resubmitted without a formal appeal. The claim is not permanently closed — it just requires additional information or a corrected submission.
Recovery path: Correct the error, gather the missing information, and resubmit. Most soft denials can be resolved within 30–60 days if actioned within 48–72 hours of receipt.
Common examples:
- Missing or incomplete documentation
- Incorrect or missing modifier
- Expired prior authorization number
- Eligibility mismatch at time of service
- Duplicate claim — originally paid
The strategic importance of this distinction: soft denials are your highest-leverage recovery opportunity. They are recoverable, usually fixable within your billing team’s existing capabilities, and the patterns they reveal often point to upstream workflow failures that — when corrected — prevent the same denial from recurring. Hard denials require more resource-intensive recovery through appeals, peer-to-peer review, and sometimes formal arbitration. But even hard denials have meaningful appeal overturn rates when properly pursued — which is why leaving any denial unworked is leaving money on the table.
What Are the Top 10 Causes of Claim Denials in 2026?
Three in four ACA plan denials stem from administrative or paperwork issues — not clinical coverage disputes (MoneyGeek, 2026). That statistic changes how you should think about denial management. Most denials are not payers protecting themselves from fraudulent claims. They are the downstream consequence of preventable upstream errors. Here are the 10 most common causes, ranked by frequency and preventability.
- Patient Eligibility and Coverage Issues
Billing an insurance plan the patient is no longer enrolled in — due to job loss, plan year change, or mid-month coverage switch. Eligibility is the most preventable denial cause and requires real-time verification before every encounter, not just at scheduling. - Missing or Invalid Prior Authorization
Rendering a service that required prior authorization without obtaining written approval first — or billing with an expired, incorrect, or unapplied authorization number. Payers are expanding prior authorization requirements aggressively in 2026, particularly for imaging, specialty medications, and elective procedures (OS Healthcare, 2026). - Medical Necessity Disputes
The payer’s automated or human review determines the service did not meet their definition of medically necessary based on the documentation submitted. AI-powered payer review systems in 2026 are flagging medical necessity at unprecedented scale and speed — with reports of 300,000+ claims denied in under two months by automated systems (OS Healthcare, 2026). - Coding Errors — CPT, ICD-10, or HCPCS
Wrong procedure code, wrong diagnosis code, unspecified ICD-10 where specificity is required, incorrect HCPCS Level II unit, or code combinations that fail NCCI edit validation. Coding errors account for approximately 42% of all claim denials (Sully.ai, 2026). - Missing or Incorrect Modifiers
Omitting Modifier 25 (significant, separately identifiable E/M on the same day as a procedure), Modifier 59 (distinct procedural service), or specialty-specific modifiers causes bundling denials or medical necessity rejections. Modifier errors are particularly common in surgical, orthopaedic, and multi-procedure encounters. - Duplicate Claim Submission
A claim submitted twice for the same date of service, same provider, same procedure, and same patient. Often happens when a first submission appears to stall and staff re-submit without confirming the original was received. Payers auto-deny the second submission as a duplicate. - Timely Filing Limit Exceeded
Claims submitted after the payer’s filing deadline — which ranges from 90 days to 12 months depending on the payer and contract. These are always hard denials and almost always preventable with systematic submission tracking. No appeal can recover a claim beyond the timely filing window. - Coordination of Benefits (COB) Errors
Billing the wrong payer when a patient has dual coverage, or not correctly sequencing primary and secondary payer claims. COB errors are common when patients have Medicare plus a commercial supplement, or when dependents are covered under multiple family policies. - Provider Credentialing and Enrollment Gaps
Submitting claims for a provider who is not yet enrolled with that payer, whose enrollment has lapsed, or whose NPI and Tax ID data does not match the payer’s records. A CAQH profile that has gone inactive from missed attestation, or a revalidation that has lapsed, both produce this category of denial at scale across all claims for that provider. - Incomplete or Insufficient Clinical Documentation
The medical record does not support the level of service billed, the medical necessity for the procedure performed, or the specificity of the ICD-10 diagnosis code used. Documentation-driven denials require a feedback loop back to the clinical team — not just a recoded resubmission that will deny again for the same reason.
What Are Claim Denial Rates by Payer Type in 2026?
Denial rates are not uniform across the payer landscape. Knowing which payers deny the most claims — and for what reasons — lets your billing team prioritize resources, build payer-specific scrubbing rules, and set realistic expectations for AR recovery timelines.
| Payer Type | Initial Denial Rate | Appeal Overturn Rate | Top Denial Drivers |
|---|---|---|---|
| Traditional Medicare | ~8.4% | ~50% | Medical necessity, documentation gaps, excluded services, NPI mismatches |
| Medicare Advantage | ~15.7% | ~53% | Prior auth, medical necessity (AI-reviewed), step therapy requirements, out-of-network |
| Medicaid | ~16.7% (highest) | ~46% | Eligibility issues, prior auth, medical necessity, state-specific policy variations |
| Managed Medicaid | ~15.1% | Varies by plan | Prior auth, medical necessity, care coordination gaps, state plan amendments |
| Commercial / Private | ~13.9–15% | 60%+ when appealed | Prior auth, eligibility, coding, plan-specific medical policies, COB errors |
| ACA Marketplace Plans | 19.1% (2024) | 56% of internal appeals upheld | Administrative/paperwork errors (77%), plan design exclusions, eligibility |
⚠ Medicare Advantage Denial Surge: Medicare Advantage denial rates jumped 4.8% from 2023 to 2024 alone — the largest single-year increase of any major payer type (OS Healthcare, 2026). With 54%+ of Medicare beneficiaries now in MA plans, this concentration of denial activity is the single biggest billing challenge facing practices with Medicare-heavy patient populations in 2026.
What Is the True Financial Cost of Claim Denials to Your Practice?
How Much Does Each Denied Claim Actually Cost?
The visible cost of a denied claim is the reimbursement you did not receive. The true cost is two to three times that — and most practices never calculate it accurately. The administrative cost per denied claim rose to $57.23 in 2023 (Aptarro, 2026) — meaning every denied claim your team works costs you $57 before you collect a single dollar.
For a practice submitting 500 claims per month at an average value of $250, a 15% denial rate means 75 claims denied monthly. At $57 administrative cost per denial plus $100 average rework cost, that is $11,775 in monthly overhead just to manage the denials — before recovering a single dollar. If 20% of those denials are never successfully recovered (industry average for unworked denials), that is $3,750 per month in permanent revenue loss. That is $45,000 per year in preventable write-offs from a billing problem that a 5% denial rate would cut by two-thirds.
Why Are Claim Denials Increasing in 2026?
Three structural trends are driving denial rate growth in 2026, and they are all payer-initiated changes that providers must adapt to proactively.
AI-powered payer review at scale: Commercial payers and Medicare Advantage plans are deploying artificial intelligence to automate claims adjudication at a pace and scale that manual review never achieved. AI flags potential medical necessity concerns, prior auth mismatches, and documentation gaps far faster than human reviewers — generating denial volumes that outpace many practices’ manual resolution capacity. Reports of automated systems denying 300,000+ claims in under two months illustrate the operational scale shift (OS Healthcare, 2026).
Expanding prior authorization requirements: Payers are widening prior authorization mandates across specialties, service types, and drug categories — particularly for diagnostic imaging, specialty medications, and elective procedures. CMS-0057-F’s interoperability requirements are accelerating API-based prior auth workflows, but many practices are still managing prior auth through manual phone and fax processes that cannot keep pace with payer-side changes.
Social determinants of health (SDOH) data integration: A growing number of payers are factoring SDOH data — access to food, transportation, safe housing — into claims review decisions, particularly for services where care setting or post-acute planning is relevant. This adds a documentation layer that most practices have not yet incorporated into their clinical records or billing workflows (OS Healthcare, 2026).
Claim Rejection vs. Claim Denial vs. Claim Underpayment: What Is the Difference?
| Factor | Claim Rejection | Claim Denial | Claim Underpayment |
|---|---|---|---|
| When it occurs | Before payer adjudication — clearinghouse or front-end system | After payer adjudication — payer has reviewed and rejected | After payer payment — payer paid less than contracted rate |
| Adjudicated? | No — returned without processing | Yes — processed and denied | Yes — processed and paid, but incorrectly |
| Common causes | Missing fields, invalid code format, wrong NPI, formatting errors | No auth, medical necessity, coding error, eligibility, timely filing | Payer contractual error, fee schedule mismatch, incorrect benefit application |
| Resolution | Correct the technical error and resubmit | Soft: correct and resubmit; Hard: formal appeal | Underpayment dispute, contract review, or RAC audit |
| Revenue impact | Delayed — recoverable if corrected quickly | Partially or fully permanent if not appealed | Permanent if not identified and disputed within contract timeline |
| Staff time required | Low — usually 10–30 minutes to correct and resubmit | Medium to high — $25–$181 per denial in rework time | High — requires contract review, payment analysis, and formal dispute |
| Qualigenix service | Claim Submission Services | Denial Management Services | AR Follow-Up Services |
Should You Appeal Every Denied Claim?
Yes — you should have a systematic process to evaluate and appeal every recoverable denial. The appeal overturn rates justify the investment: private payers overturn over 60% of appealed denials, Medicare Advantage overturns approximately 53%, and Medicare overturns approximately 50% (Premier Inc., TechTarget, 2026).
The problem is not that appeals do not work. It is that most practices do not pursue them consistently. Fewer than 0.2% of denied ACA marketplace claims are appealed internally (MoneyGeek, 2026). That is an extraordinary amount of recoverable revenue left uncollected because denial management is treated as a back-office task rather than a systematic revenue function. The revenue math is straightforward: if you have 75 denied claims per month averaging $250 each, and 60% of appeals are overturned, pursuing appeals recovers approximately $11,250 per month — minus the cost of the appeals process.
The practical barrier is that appeals require claim-by-claim attention — identifying the denial reason code, gathering the appropriate supporting documentation, writing the appeal narrative, submitting within the payer’s deadline, and tracking the response. For most in-house billing teams, this systematic workload is not feasible alongside daily claim submission responsibilities. That is precisely where a dedicated denial management partner delivers disproportionate value.
What Is Root-Cause Denial Analysis and Why Does It Matter More Than Claim-by-Claim Recovery?
Root-cause denial analysis is the practice of tracing denied claims back to their origin point in the workflow — not just correcting the individual claim, but identifying the process failure that caused it — and fixing that process to prevent the same denial from recurring.
The difference is between treating symptoms and treating the disease. If your billing team resubmits a corrected claim for a modifier error on Encounter A, that is claim recovery. If your billing team identifies that Encounters A, B, C, D, and E all have the same modifier error on the same CPT code, traces it to a coding workflow that systematically omits Modifier 25 on same-day procedure visits, and corrects the coding protocol — that is root-cause analysis. One approach recovers five claims. The other prevents 50 future denials from occurring.
Qualigenix’s denial management services operate on a root-cause model. Every denial is categorized by reason code, CPT family, provider, and payer. Patterns are identified across 30-day rolling windows. When a denial pattern exceeds a threshold — even for a single reason code — a workflow investigation begins upstream. Coding protocols get updated. Documentation templates get revised. Pre-authorization workflows get adjusted. The denial rate drops not because one claim was fixed, but because the source of the denial was closed.
How Does Qualigenix Reduce Claim Denials for Your Practice?
Qualigenix’s approach to claim denials is built around prevention first, recovery second, and root-cause elimination third. This sequence reflects a fundamental truth about denial management: the highest return on investment comes from stopping denials before they happen, not from working through a backlog of rejected claims that already cost your practice staff time and cash flow.
Prevention layer: Qualigenix’s eligibility verification services run real-time coverage checks before every encounter — catching eligibility issues before a claim is even generated. The medical coding services apply 99% claim accuracy through CPC-certified specialty coders, payer-specific edit rule libraries, NCCI edit validation, and CPT-ICD-10 clinical logic checks. Every claim passes through clearinghouse scrubbing before submission — catching 80–90% of format-level errors before a denial is possible. The prior authorization solutions track authorization requirements by payer and CPT code, ensuring no service reaches the billing queue without documented approval.
Recovery layer: When denials do occur — and some always will — every denied claim is worked within payer-specific appeal timelines. Qualigenix’s denial specialists categorize each denial by CARC and RARC reason code, determine whether it is a soft denial (correct and resubmit) or hard denial (formal appeal), gather clinical documentation, write appeal narratives, and track every open appeal to resolution. No denial ages out unworked.
Root-cause elimination layer: Monthly denial pattern reports categorize every denial by reason, payer, CPT family, and provider. Patterns trigger upstream process reviews. Coding workflow corrections, documentation template updates, and prior authorization protocol adjustments are made proactively — reducing the recurrence rate of systematic denial patterns. The clinical documentation feedback loop surfaces provider-specific documentation gaps that create medical necessity denials, with structured queries that improve documentation quality at the point of care — not after the denial arrives.
The result: a 30% reduction in AR days and a 36-day average collection cycle — the financial outcome of fewer denials, faster resolution, and cleaner claims from submission through payment posting.
Claim Denial Prevention Checklist: 10 Steps to Protect Your Revenue
- ☐ Verify patient eligibility in real time before every encounter: Not at scheduling — before. Coverage changes monthly. A patient whose insurance lapsed three weeks ago will generate an eligibility denial on every claim billed to that payer.
- ☐ Confirm prior authorization before every service that requires it: Check the payer’s current prior auth list monthly — it changes. Log authorization numbers, approved service dates, and approved quantities in every patient record before the encounter.
- ☐ Use specialty-trained coders on every encounter: Generalist coding generates specialty-specific denial patterns that repeat indefinitely. Specialty-trained coders know the modifier rules, documentation requirements, and payer-specific edit preferences for your procedure types.
- ☐ Run every claim through clearinghouse scrubbing before submission: Enable payer-specific edit rules, NCCI edit validation, and CPT-ICD-10 pair logic. Clearinghouses catch 80–90% of avoidable errors before the payer ever sees the claim.
- ☐ Set up denial tracking by CARC/RARC reason code and payer: You cannot fix what you do not categorize. Log every denial with reason code, payer, CPT family, provider, and date. Review the log weekly.
- ☐ Perform root-cause analysis on any denial reason exceeding 5% of total denials: If one reason code accounts for 5%+ of your monthly denials, it is a process problem — not a billing incident. Trace it to its origin and fix the workflow.
- ☐ Appeal every recoverable denial within payer deadlines: Private payers overturn 60%+ of appealed denials. Unappealed recoverable denials are permanent write-offs. Build a systematic appeals calendar for every open denial.
- ☐ Send documentation feedback to clinical staff for documentation-driven denials: When denials trace to documentation gaps — inadequate medical necessity, wrong specificity, missing clinical elements — query the provider and update documentation templates. Recoding alone does not prevent recurrence.
- ☐ Monitor payer policy bulletins monthly for prior auth and coverage changes: Commercial payers and Medicare Advantage plans update coverage policies, prior authorization requirements, and coding rules regularly. Subscribe to your top five payers’ provider bulletins.
- ☐ Benchmark your denial KPIs monthly against industry standards: Target: under 5% denial rate, 95%+ first-pass acceptance, under 40 AR days. Any metric above benchmark triggers an immediate root-cause review — not next quarter, this month.
Frequently Asked Questions About Claim Denials
What are claim denials in medical billing?
Claim denials occur when a health insurance payer refuses to reimburse a provider for services already rendered. Denials happen after the claim is adjudicated — the payer received it, reviewed it, and determined it does not meet their coverage criteria, documentation requirements, or billing rules. In 2026, the average initial claim denial rate across all payer types is approximately 11.8%, with some payer categories exceeding 19%.
The critical distinction from a claim rejection is that denials occur after adjudication. A rejection is a pre-adjudication technical failure — the claim never made it into the payer’s review system. A denial means the payer reviewed the claim and actively refused payment. Rejections are corrected and resubmitted; denials require appeals with supporting documentation or formal dispute processes.
What is the difference between a hard denial and a soft denial?
A hard denial is a permanent payer rejection — the claim is ineligible for reimbursement and cannot be resubmitted without a formal appeal. Examples include non-covered services, timely filing limit exceeded, and services by non-credentialed providers. A soft denial is temporary — the claim can be corrected and resubmitted. Examples include missing modifiers, expired prior auth numbers, and incomplete documentation.
The most important operational difference is the resolution timeline. Soft denials should be corrected and resubmitted within 48–72 hours of receipt — before they age into harder recovery territory. Hard denials require structured appeal narratives, clinical documentation, and submission within payer-specific appeal windows that range from 30 to 180 days.
What are the most common reasons for claim denials?
The top 10 claim denial causes are: patient eligibility issues, missing or invalid prior authorization, medical necessity disputes, coding errors (CPT/ICD-10/HCPCS), missing or incorrect modifiers, duplicate claim submission, timely filing limit exceeded, coordination of benefits errors, provider credentialing gaps, and incomplete clinical documentation. Coding errors alone account for approximately 42% of all denials (Sully.ai, 2026). Three in four ACA plan denials stem from administrative errors rather than medical necessity disputes.
How do you appeal a denied claim?
To appeal a denied claim: (1) identify the denial reason using the CARC and RARC codes on the EOB or ERA; (2) determine if it is a soft denial (correct and resubmit) or hard denial (formal appeal required); (3) gather supporting documentation — clinical notes, prior auth approval, medical necessity letter; (4) write an appeal narrative addressing the specific denial reason; (5) submit within the payer’s appeal deadline (typically 30–180 days); (6) track the appeal status and escalate to peer-to-peer review if the first-level appeal is denied.
Appeal deadlines are payer-specific and non-negotiable. Missing an appeal window converts a recoverable denial into a permanent write-off. Build an appeals calendar that tracks every open denial by payer, denial date, and appeal deadline — with escalation triggers for claims approaching the deadline without resolution.
How much do claim denials cost healthcare providers?
The administrative cost per denied claim rose to $57.23 in 2023, up from $43.84 the prior year (Aptarro, 2026). Reworking a denied claim costs $25–$181 in staff time. Hospitals lose an average of $5 million annually — 5% of net patient revenue — to claim denials (Journal of AHIMA). If 20% of denied claims are never successfully recovered, a $100,000 monthly denial volume generates $20,000 per month in permanent loss — $240,000 per year in preventable write-offs.
What is the industry benchmark for claim denial rates?
The industry benchmark for a well-managed practice is a first-pass claim denial rate below 5%. A clean claim rate of 95% or higher and AR days under 40 are the accompanying KPIs. Practices with denial rates between 5–10% have significant improvement opportunity. Practices above 10% — which includes 38–41% of US providers in 2026 — are experiencing systematic revenue leakage that compounds month over month without intervention.
Qualigenix achieves 95% first-pass acceptance and 99% claim accuracy across all specialties and payer types — benchmarks that reflect what becomes possible when denial prevention is built into every upstream step of the billing workflow rather than managed reactively after denials arrive.
How does Qualigenix reduce claim denials?
Qualigenix reduces claim denials through three integrated layers: prevention (real-time eligibility verification, prior authorization management, 99% coding accuracy, clearinghouse scrubbing), recovery (systematic appeals for all recoverable denials within payer deadlines), and root-cause elimination (monthly denial pattern analysis, coding workflow corrections, documentation feedback loops). The result: 95% first-pass acceptance, 30% AR days reduction, and a 36-day average collection cycle.
The root-cause layer is what makes the improvement sustainable. Most billing teams recover individual denials but do not prevent the same denial from recurring next month. Qualigenix’s systematic pattern analysis ensures that denial-causing workflow gaps are closed at their source — reducing total denial volume month over month rather than simply managing a stable denial rate.
Related Qualigenix Resources
Service Pages:
- Denial Management Services — Root-cause analysis, appeals management, pattern elimination
- Eligibility Verification Services — Stop eligibility-driven denials before they start
- Prior Authorization Solutions — Systematic auth management, no missed authorizations
- Medical Coding Services — 99% coding accuracy, eliminate coding-driven denials
- AR Follow-Up Services — Track every unpaid claim, nothing ages out unworked
- Claim Submission Services — Clean first-pass claims from submission to payment
Blog Guides:
- Denial Management Process: 5 Essential Steps
- 7 Common Causes of Denial in Medical Billing
- How to Reduce Medical Claim Denials: 2026 Guide
- How to Appeal an Insurance Claim Denial Step-by-Step
- What Is a Clean Claim Rate? Benchmarks & Best Practices
- RCM KPI Benchmarking: Healthcare Standards for 2026
- What Is Medical Coding? Complete Guide 2026
- Healthcare Billing Process Explained: End-to-End Workflow
Stop Losing Revenue to Preventable Claim Denials
Qualigenix’s denial management services prevent denials before submission and recover revenue when they do occur — through root-cause analysis, systematic appeals, and a documentation feedback loop that closes the gaps permanently.
Our team delivers 99% claim accuracy, a 95% first-pass acceptance rate, an average 36-day collection cycle, and a 30% reduction in AR days. We onboard in as few as 6 days, starting with an immediate denial rate assessment and gap analysis for your practice.
Precision. Progress. Qualigenix.
What’s Next

Denial Management in 2026: The Top 10 Codes and the Appeal Playbook for Each
Denials cluster around a small set of codes, and each one has a different correct response. Some need a...

ASC Billing: Where Facility Fees and Physician Fees Get Miscoded Together
ASC facility and physician claims both go out on a CMS-1500 form with the same CPT code and place...

Coordination of benefits errors: why secondary payer claims take 3x longer to resolve
Secondary payer claims stall because coordination of benefits errors, wrong payer order, outdated COB records, and missing primary...