Accounts Receivable in Medical Billing: Complete Guide 2026
The Qualigenix Editorial Team consists of certified billing and coding experts with over 40 years of experience across 38+ medical specialties. Our content is rigorously researched against CMS, AMA, and payer-specific guidelines to ensure total compliance and accuracy. We apply the same elite standards to our resources as we do our client work, consistently delivering high claim accuracy and significant reductions in AR days.
Accounts receivable (AR) in medical billing is every dollar your practice has earned but not yet collected — sitting between claim submission and final payment. The MGMA benchmark for Days in AR is under 40 days; top performers operate at 30–35 days. Every denied claim automatically adds 15–30 days to AR. Practices conducting quarterly payer variance reviews collect 8–12% more per claim than those that don’t. And every 1% improvement in Net Collection Rate on a $5M practice recovers approximately $50,000 annually. AR management is where revenue is won or quietly lost — and the difference is almost always process, not effort.
Accounts receivable is the financial bloodstream of every medical practice. Unpaid claims, pending insurance reimbursements, denied claims sitting in appeal queues — all of it is AR. Furthermore, each day that money stays in AR rather than in your bank account is a day your practice is essentially extending an interest-free loan to an insurance company that has already adjudicated and decided on your claim.
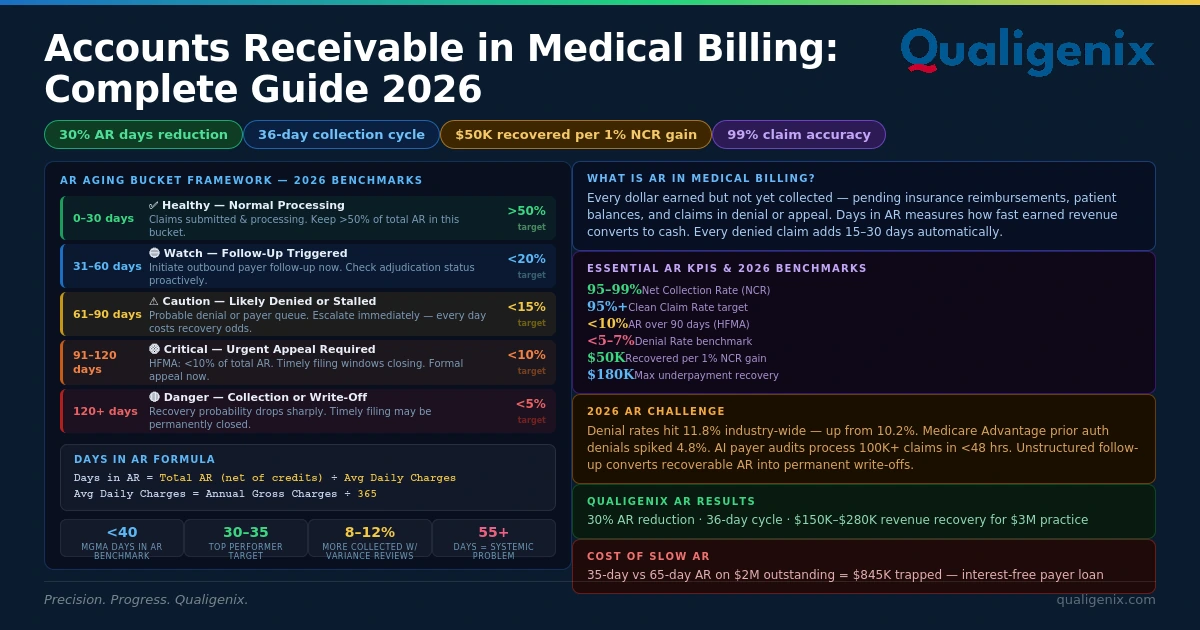
The problem in 2026 is that AR is growing, not shrinking, for most US practices. Initial claim denial rates hit 11.8% industry-wide in 2024 — up from 10.2% just a few years earlier (MBC, 2026). As a result, Medicare Advantage alone saw a 4.8% spike in prior authorization denials as payers deployed AI-driven audit tools at unprecedented scale. Consequently, each denial adds 15–30 days to AR automatically — not from the denial date, but from the original service date, retroactively aging a claim that was already outstanding. Multiply that by thousands of claims per month and the AR impact becomes enormous.
However, the bigger problem is not the denials themselves. Rather, it is what practices do — or do not do — after a claim is denied or delayed. Unstructured follow-up. No aging bucket discipline. Monthly KPI reviews instead of weekly ones. Payer variance analyses that never happen. These process failures convert recoverable AR into permanent write-offs, quietly compounding month after month until AR days hit 55, 60, 70+ and cash flow becomes a weekly crisis rather than a stable financial foundation.
This guide covers every dimension of accounts receivable in medical billing — the definition, the formula, the aging bucket framework, the essential KPIs and their benchmarks, the root causes of elevated AR, a systematic reduction strategy, and how Qualigenix AR follow-up services achieve a 30% reduction in AR days with a 36-day average collection cycle.
What Is Accounts Receivable in Medical Billing?
Accounts receivable (AR) in medical billing is the total amount owed to a healthcare provider for services already rendered but not yet paid — by insurance payers, Medicare, Medicaid, or patients. It represents revenue that has been earned but not yet collected, and includes every pending insurance reimbursement, every unpaid patient balance, and every claim in denial or appeal status. Days in AR measures how long, on average, it takes your practice to convert billed services into collected revenue.
AR is not a static balance. Rather, it is a living, aging pool of revenue in different stages of collection. Claims in the 0–30 day range are submitted, processing, and expected. Beyond that, anything that has aged to 61–90 days is likely denied, delayed, or stuck in a payer queue without anyone following up. Most critically, claims past 120 days have entered territory where collection probability drops sharply and timely filing windows begin to close permanently.
Consequently, the speed at which AR moves from “earned” to “collected” is the central measure of revenue cycle health. Consider a practice with $2 million in outstanding AR collecting in 35 days — that practice is financially healthy. By contrast, that same practice collecting in 65 days traps roughly $845,000 in additional unearned cash — money the practice earned but cannot deploy because the billing and collections process is slow. Furthermore, that trapped revenue carries a real cost: it limits operating capital, restricts hiring, delays equipment purchases, and creates the kind of cash flow stress that forces short-term financial decisions no practice should have to make.
Medical Accounts Receivable: Key Statistics and Benchmarks 2026
| Metric | Value / Benchmark |
|---|---|
| MGMA Days in AR benchmark (most specialties) | Under 40 days — top performers at 30–35 days |
| High-performing practice Days in AR target | Under 35 days (AMS Solutions, 2026); top-tier near 25–30 days (Plutus Health, 2026) |
| AR above 55 days | Signals a systemic billing or denial management problem requiring immediate attention (MGMA) |
| HFMA AR over 90 days benchmark | Should be less than 10% of total receivables |
| Self-pay AR over 90 days benchmark | Should be less than 30% of self-pay receivables (HFMA) |
| Average days added per denied claim | 15–30 days per denial event added to AR cycle |
| Impact of quarterly payer variance reviews | 8–12% more collected per claim vs. practices that don’t (HFMA 2024 Revenue Cycle Survey) |
| Net Collection Rate — industry minimum benchmark | 95% (Beckers, HFMA); top-tier 97–99% |
| Clean Claim Rate — industry target | 95%+; Beckers ASC recommends 98% |
| Denial rate impact on AR | Each 1% increase in denial rate = 15–30 additional AR days without structured resolution |
| Underpayment recovery (payer variance review) | Most practices recover $80K–$180K annually in previously unidentified underpayments (MBC, 2026) |
| Revenue recovery — structured AR management | $150K–$280K annually for a $3M practice vs. unmanaged AR approach (MBC, 2026) |
| Outsourced billing AR days reduction | 20–35% reduction in Days in AR within first 90 days (MBC, 2026) |
| NCR improvement ROI ($5M practice) | Every 1% improvement in NCR = ~$50,000 in recovered annual revenue |
| Qualigenix AR days reduction | 30% average reduction — from engagement to stabilized performance |
| Qualigenix average collection cycle | 36 days — from claim submission to payment posting |
How Do You Calculate Days in AR for Medical Billing?
Days in AR (also called Days in Accounts Receivable or DAR) is the single most important measure of revenue cycle velocity. Specifically, it tells you how many days pass, on average, between billing a service and collecting payment for it. The formula is straightforward; however, the details matter — particularly the treatment of credits and the time period you use for average daily charges.
Days in AR Formula
Days in AR = Total Current AR (net of credits) ÷ Average Daily Charges
Step 1: Average Daily Charges = Total Gross Charges (past 12 months) ÷ 365
Step 2: Days in AR = (Total AR − Credit Balance) ÷ Average Daily Charges
Worked Example: Annual gross charges = $18,000,000 → Average daily charges = $49,315 | Total AR = $2,000,000 → Days in AR = $2,000,000 ÷ $49,315 = 40.6 days
Three Calculation Mistakes That Skew Your AR Results
Even practices that calculate Days in AR regularly often make errors that produce misleadingly optimistic numbers. Avoid these three common pitfalls:
- Not subtracting credits: Including credit balances in total AR inflates the numerator and produces an overly optimistic Days in AR figure. Therefore, always subtract credits from total receivables before calculating.
- Including collection accounts: Accounts sent to a collection agency are typically written off current receivables. As a result, calculating Days in AR both with and without collection revenue gives you a clearer picture of true operational performance.
- Masking aged buckets with a healthy overall number: A Days in AR of 38 looks fine — until you discover that 22% of your AR exceeds 90 days. Consequently, always calculate AR aging distribution alongside your overall Days in AR. A healthy aggregate can hide a significant aging crisis in specific payer buckets (AAFP, 2026).
What Are AR Aging Buckets and How Should You Manage Each One?
AR aging buckets segment your outstanding receivables by how long they have been unpaid. The bucket a claim sits in determines both its recovery probability and the appropriate follow-up action. Moreover, managing AR by aging bucket — not just by total AR balance — is what separates practices with controlled cash flow from those fighting perpetual AR fires.
| Aging Bucket | Status | Required Action | Recovery Probability |
|---|---|---|---|
| 0–30 Days | Current — Expected | Monitor | Confirm ERA receipt by Day 25 | Very High — in normal processing window |
| 31–60 Days | Early Aging — Watch | Verify receipt | Confirm no silent rejection | High — if actioned promptly |
| 61–90 Days | Active Follow-Up Required | Follow-up call | Request status | Initiate denial response | Moderate-High — declining without action |
| 91–120 Days | High Risk — Urgent | Escalate | File appeal immediately | Assign deadline | Moderate — HFMA benchmark threshold (keep below 10%) |
| 120+ Days | Critical — Recovery Risk | Triage immediately | Timely filing at risk | All-hands resolution | Low — drops sharply; permanent loss beyond 180 days |
Here is how high-performing practices manage each bucket:
0–30 days: This is your normal processing window for most payers. Medicare and many commercial payers process clean claims within 14–21 days. No active follow-up is typically needed unless a claim fails to appear in the ERA by Day 25. Monitor this bucket for unusual volume accumulation that might signal a clearinghouse or submission failure.
31–60 days: Something has slowed the claim. It may be in a payer processing queue, may have been denied without the denial reaching your system yet, or may have been rejected at the clearinghouse level without notification. Run status checks on all claims entering this bucket to confirm receipt and identify silent rejections before they age further.
61–90 days: Active follow-up is required for every claim in this range. Pull the payer’s explanation of benefits or call the provider services line. If denied, categorize the denial reason and initiate the appropriate response — corrected resubmission for soft denials, formal appeal for hard denials. Every day a denied claim ages without action is a day closer to the timely filing window closing.
91–120 days: Urgent. HFMA recommends keeping AR over 90 days below 10% of total receivables — because recovery probability drops significantly at this point. Claims in this bucket should be escalated to senior billing staff or a dedicated follow-up team. Every claim here needs a specific resolution action assigned with a deadline. Timely filing windows for most commercial payers run 90–180 days from the date of service.
120+ days: Critical. Beyond 120 days, payer contract terms increasingly favor the payer, and some timely filing windows have already closed permanently. Claims in this bucket require immediate triage: Is the timely filing window still open? Is there a documented reason code that supports an exception appeal? Has the patient balance been separated and statements sent? Claims beyond 180 days are often effectively uncollectable from insurance payers and must be evaluated for patient billing or write-off decisions.
⚠ The 120-Day Write-Off Risk: Accounts receivable that ages past 120 days without a structured resolution workflow has a dramatically lower collection probability. Beyond 180 days, most of that revenue is effectively gone — payer contract provisions favor the payer, CMS regulatory provisions limit retroactive processing, and timely filing windows close permanently (Viaante, 2026). The earlier aged claims are identified and worked, the higher the recovery rate.
What Are the Key AR KPIs Every Medical Practice Must Track?
AR management without KPI measurement is guesswork. You cannot improve what you do not systematically measure. High-performing practices in 2026 review these metrics weekly — not monthly, not quarterly. The reason is straightforward: problems identified weekly are resolved before they compound into financial crises. By contrast, problems discovered monthly have already cost the practice four weeks of recoverable revenue.
| KPI | Formula | ✅ Strong | ⚠ Needs Work | 🚨 Problem |
|---|---|---|---|---|
| Days in AR (DAR) | Total AR (net credits) ÷ Avg. Daily Charges | Under 35 days | 35–50 days | Above 55 days |
| Net Collection Rate (NCR) | Payments (net credits) ÷ Charges (net contractuals) × 100 | 97–99% | 95–97% | Below 92% |
| Clean Claim Rate (CCR) | Claims paid on 1st submission ÷ Total claims submitted × 100 | 95–98% | 90–95% | Below 90% |
| Denial Rate | Total denied claims ÷ Total claims submitted × 100 | Under 5% | 5–10% | Above 10% |
| AR Over 90 Days (%) | Dollar value of AR >90 days ÷ Total AR × 100 | Below 10% | 10–20% | Above 20% |
| Bad Debt Ratio | Total bad debt ÷ Total service revenue × 100 | Under 3% | 3–5% | Above 5% |
What Causes High Accounts Receivable in Medical Billing?
Where Does Elevated AR Actually Originate in the Revenue Cycle?
Elevated AR rarely has a single cause — it almost always reflects multiple compounding failures across different stages of the revenue cycle, each adding days to the collection cycle without anyone connecting them to the aggregate AR problem. Understanding where AR originates helps practices target interventions at the right stage rather than throwing follow-up resources at symptoms instead of causes.
- Claim Denials — Adding 15–30 Days Per Event
Each denied claim adds 15–30 days to AR automatically. If a claim is denied on Day 20, the corrected resubmission (if handled promptly) re-enters processing on Day 25, with another 14–21 days before payment. That is 40–45 days from service date to payment on a clean correctable denial — double the baseline AR cycle. With denial rates averaging 11.8% industry-wide, this compounds across thousands of claims per month. - Slow or Absent Follow-Up on Unpaid Claims
Claims do not collect themselves. Without a structured 7/17/30 follow-up cadence for aging claims, unpaid receivables simply age — moving from 31–60 days to 61–90 days to 91–120 days without anyone contacting the payer or resolving the underlying issue. Unstructured follow-up is the single most common root cause of high AR in practices with otherwise functional billing operations. - Coding Errors Requiring Rework Before Resubmission
A coding error that causes denial does not just add 15–30 days — it adds the time to identify the error, research the correct coding, revise the claim, and resubmit. For complex multi-code claims in cardiology, orthopedics, or oncology, that rework cycle can take 5–10 business days per claim. Multiplied across dozens of similar claims, coding-driven denials become a significant AR acceleration force. - Missing Prior Authorizations Generating Hard Denials
A service rendered without confirmed prior authorization generates a hard denial — often non-recoverable because retro-authorization requests are rarely granted for services already performed. These hard denials do not get resolved through rework; they get written off. That write-off directly increases bad debt ratio and reduces NCR, both of which reflect in elevated AR metrics. - Delayed Claim Submission (Beyond 24–48 Hours)
Each day between service and claim submission adds a day to AR before the payer even sees the claim. A practice submitting claims weekly instead of daily automatically adds 3–5 days to every claim’s AR cycle. For a practice billing $3M annually, that systematic delay traps an additional $41,000–$68,000 in AR at any given moment. - Slow-Paying Payers Not Tracked Separately
Some payers consistently pay slower than others — Medicaid programs in many states, certain Medicare Advantage plans, and specific commercial carriers all run processing cycles that extend well beyond the average. Consequently, if teams do not track slow-paying payers separately in AR aging reports, those payers inflate overall AR days and mask the actual performance of the rest of the portfolio. - Patient Balance Collection Gaps
Patient responsibility has grown dramatically as deductibles and coinsurance represent an increasing share of healthcare reimbursement. Specifically, patient balances under $200 are the fastest-aging segment in most practices (MBC, 2026). Without proactive digital statements, payment plan options, and upfront financial communication, patient-responsibility AR ages quickly and converts to bad debt at higher rates than insurance AR.
Why Most AR Problems Are Upstream, Not Downstream
Notice that the majority of the causes above originate before a claim is ever submitted — in eligibility verification, authorization management, coding accuracy, and submission speed. Consequently, the highest-return AR interventions are front-end improvements, not back-end collection pushes. Practices that invest in fixing the front end of the revenue cycle reduce aged AR far more sustainably than those that focus exclusively on working old claims.
What Is a Payer Variance Analysis and Why Does It Matter for AR?
A payer variance analysis compares what a payer is contractually obligated to pay for a given service against what they actually paid — thereby identifying underpayments that most practices accept as payment-in-full without realizing they were shortchanged. HFMA’s 2024 Revenue Cycle Survey found that practices conducting quarterly payer variance reviews collect 8–12% more per claim than those that don’t. For a $3M practice, a 10% improvement in per-claim revenue equals $300,000 in additional annual income from the same claim volume.
Here is how the mechanics work: your billing system stores the contracted fee schedule for each payer. After ERA posting, your team should compare each payment against the expected contractual rate. Discrepancies — underpayments — then generate a worklist for follow-up. Moreover, most practices recover $80,000–$180,000 annually in underpayments they previously did not know existed (MBC, 2026). This revenue was technically collected — just not at the correct amount. The difference sits in the payer’s pocket, not yours, unless you run the comparison and formally dispute it.
Payer variance analysis is distinct from denial management: denials are claims that received no payment; underpayments are claims that received incorrect payment. Both reduce Net Collection Rate, but they require different resolution workflows. Denials go through the appeals process; underpayments go through a contract dispute process referencing the specific fee schedule provisions and CPT/service type in question.
How Does the 7/17/30 Follow-Up Cadence Reduce AR Days?
The 7-day/17-day/30-day follow-up cadence is the most effective operational structure for preventing claims from aging past the 60-day threshold — the point at which collection probability begins declining meaningfully.
In practice, it works as follows: on Day 7 after submission, your team checks the ERA or payer portal for claim receipt confirmation and early processing status. On Day 17, if no payment or denial has arrived, your team initiates a payer portal status check or a phone call. Then on Day 30, if the claim remains unresolved, a supervisor billing specialist escalates the case with priority action and documents the outcome.
This cadence keeps every claim in active status rather than passive waiting. Without it, claims slip from 30 to 60 to 90 days without a single touchpoint — and by Day 90, teams essentially start the resolution process from scratch: no prior contact with the payer, no established appeal thread, and a shrinking timely filing window. Furthermore, high-performing revenue cycle teams measure staff performance on dollars resolved per day, not just on claims touched — because ultimately the goal is collection, not mere activity.
In-House AR Management vs. Outsourced AR Follow-Up: Which Delivers Better Results?
| Factor | In-House AR Management | Outsourced AR Follow-Up |
|---|---|---|
| Days in AR (typical) | 50–70 days (without dedicated AR team) | 30–40 days (with specialized follow-up workflows) |
| Denial rate | 12–18% (limited payer-specific expertise) | 2–5% (systematic prevention and payer-specific rules) |
| Follow-up cadence | Ad-hoc — reactive when cash flow signals problems | Structured 7/17/30-day cadence — every claim tracked |
| Payer variance analysis | Rarely performed — no dedicated staff capacity | Monthly — $80K–$180K average annual recovery |
| 90+ day AR management | Often abandoned after 90 days without resolution | Escalated to senior specialists — every claim worked |
| Staff turnover impact | High — single-person follow-up means gaps during absences | None — team-based model, no single point of failure |
| Annual cost (2–3 provider practice) | $180K–$240K (salary, benefits, software, training) | 5–8% of collections — scales with revenue, not headcount |
| Net Collection Rate | 88–93% typical without dedicated AR management | 95–99% with systematic follow-up and underpayment review |
| Best for | Large practices (10+ providers) with dedicated billing managers | Solo to mid-sized practices; any practice with AR above 45 days |
How Does Qualigenix Reduce Days in AR for Your Practice?
Qualigenix’s approach to accounts receivable management rests on one core principle: resolve AR problems upstream, not downstream. The fastest path to lower Days in AR is not working harder on aged claims — it is preventing those claims from aging in the first place. In practice, that means submitting clean claims within 24–48 hours, verifying eligibility before every encounter, confirming prior authorizations before service, and maintaining coding accuracy high enough that 95% of claims pay on first submission.
Prevention First: Where the 99% Accuracy Rate Pays Off
The prevention layer is where Qualigenix’s 99% claim accuracy rate and 95% first-pass acceptance rate deliver their most direct impact on AR. Specifically, each claim that pays on first submission is a claim that never enters the 31–60 day follow-up queue, never requires rework, and never risks aging past 90 days into the territory where collection probability drops. Starting from 95% first-pass acceptance instead of 80% means 150 fewer claims per 1,000 submissions need any follow-up at all — a structural difference that compounds across every billing cycle and sustains lower AR days month after month.
For claims that do require follow-up, Qualigenix implements the 7-day/17-day/30-day cadence for all open claims — not just high-value ones. The AR follow-up services track every open claim by aging bucket, payer, and denial category. Additionally, high-value and high-risk claims approaching 90 days receive escalation to senior billing specialists before they cross into critical territory. As a result, no claim ages to 120+ days without a specific resolution action on file.
Payer Variance and Denial Management: Closing the Revenue Gaps
Monthly payer variance analysis is built into Qualigenix’s standard AR management workflow — not offered as an add-on service. After every ERA posting cycle, Qualigenix compares expected contracted rates against actual payments by payer. Underpayments are documented, disputed, and followed through to resolution. Notably, for most practices transitioning to Qualigenix management, this single process recovers meaningful underpayment revenue in the first 90 days that their teams had previously accepted as correct payment.
The denial management integration ensures that every denied claim is categorized by root cause — coding error, eligibility failure, prior auth gap, or medical necessity dispute. Thereafter, Qualigenix resolves each denial at the workflow level, not just the claim level. Denial patterns that surface across multiple claims trigger upstream process corrections that prevent future denials in the same category. This continuous improvement loop is what sustains a 30% reduction in AR days over time rather than producing a one-time improvement that reverts when staff changes occur or payer policies shift.
Real-Time Reporting: Visibility You Can Act On
Real-time reporting dashboards give practice administrators live visibility into Days in AR, Clean Claim Rate, Net Collection Rate, denial rates by payer, and AR aging distribution — updated continuously, not delivered in monthly PDF snapshots. The goal is to make AR management as transparent and actionable as possible. Consequently, your leadership team sees problems developing before they become cash flow crises — rather than discovering them weeks after the damage is done.
Accounts Receivable Management Checklist: 10 Steps to Reduce AR Days
- ☐ Calculate Days in AR correctly — net of credits, by payer: Include credit subtraction, separate patient vs. insurance AR, and calculate aging distribution alongside the headline number. A healthy aggregate AR days figure can mask a crisis in specific payer buckets.
- ☐ Verify patient eligibility before every single encounter: Eligibility errors identified after service always add 30+ days to AR and generate denials that are difficult to recover. Real-time eligibility verification is the highest-leverage AR prevention step available.
- ☐ Confirm prior authorization before scheduling — not after service: Missing authorization generates hard denials that are often unrecoverable. Treat authorization confirmation as a scheduling prerequisite, not a billing afterthought.
- ☐ Submit claims within 24–48 hours of service: Every day between service and claim submission is a day added to AR before the payer sees the claim. Weekly batch submission is an internal delay that compounds AR days for every claim in the practice.
- ☐ Implement a 7/17/30-day follow-up cadence for all open claims: Structure follow-up as a timed workflow, not a reactive task. Claims without structured follow-up age silently — from 30 to 60 to 90+ days — without anyone contacting the payer.
- ☐ Segment AR by aging bucket and review weekly: Separate 0–30, 31–60, 61–90, 91–120, and 120+ day buckets. Assign dedicated follow-up actions to each bucket. Keep 90+ day AR below 10% of total receivables per HFMA benchmark.
- ☐ Conduct monthly payer variance analysis: Compare actual payments against contracted rates for every payer. Most practices recover $80K–$180K annually in underpayments once this process is implemented. An unchallenged underpayment is a permanent revenue loss.
- ☐ Track Net Collection Rate monthly — not just Days in AR: NCR reveals how much of collectible revenue is actually being collected. A low NCR on high Days in AR means revenue is both slow and incomplete. Target: 95% minimum, 97–99% for top performance.
- ☐ Work every claim aging past 90 days with a resolution deadline: Assign every 90+ day claim a specific follow-up action and a resolution deadline. Claims that reach 90 days without a documented action plan are at high risk of becoming write-offs.
- ☐ Review AR KPIs weekly — deny yourself the comfort of monthly reviews: High-performing practices in 2026 review Days in AR, Clean Claim Rate, NCR, denial rate, and AR aging weekly. Problems identified weekly are resolved before they compound. Monthly reviews identify problems 3–4 weeks after they started costing money.
Frequently Asked Questions About Accounts Receivable in Medical Billing
What is accounts receivable in medical billing?
Accounts receivable (AR) in medical billing is the total amount owed to a healthcare provider for services already rendered but not yet collected — from insurance payers, Medicare, Medicaid, or patients. It includes every pending insurance reimbursement, every unpaid patient balance, and every claim in denial or appeal status. Furthermore, Days in AR measures how long it takes, on average, to convert billed services into collected revenue.
AR is not a static number — it is a living pool of revenue at different stages of collection. Managing it effectively requires understanding not just the total balance but how it distributes across aging buckets, which payers pay slowly, and where in the revenue cycle delays originate.
How do you calculate Days in AR?
Days in AR = Total Current AR (net of credits) ÷ Average Daily Charges. Average Daily Charges = Total Gross Charges for 12 months ÷ 365. For example, if total AR is $2,000,000 and average daily charges are $49,315, Days in AR equals 40.6 days. Critically, always subtract credit balances from total AR before calculating — including credits produces an artificially low, overly optimistic Days in AR figure.
Additionally, calculate Days in AR with and without collection agency accounts, and calculate aging distribution (AR over 90 days as a % of total) alongside the headline figure. A healthy aggregate Days in AR of 38 can mask a serious aging crisis if 20% of your AR exceeds 90 days — which is double the HFMA benchmark of 10%.
What is a good Days in AR benchmark for medical practices?
The MGMA benchmark is under 40 days for most specialties. Top-performing practices target under 35 days, with elite revenue cycle operations near 25–30 days. AR above 55 days signals a systemic billing or denial management problem that requires immediate attention. By comparison, Qualigenix achieves a 36-day average collection cycle for managed practices — 30% below typical in-house performance levels.
Benchmarks vary somewhat by specialty. Therefore, compare your Days in AR against specialty-specific MGMA benchmarks rather than a universal number, but treat 40 days as a universal warning threshold regardless of specialty.
What is the net collection rate and why does it matter?
Net Collection Rate (NCR) measures the percentage of collectible revenue that a practice actually collects. Formula: NCR = Payments (net of credits) ÷ Charges (net of contractual adjustments) × 100. The minimum benchmark is 95%; top-tier practices achieve 97–99%. Moreover, every percentage point below 97% on a $5M practice represents approximately $50,000 in annual uncollected revenue.
NCR is more diagnostic than Days in AR because it measures the completeness of collection, not just the speed. Specifically, a practice can achieve low Days in AR but still show a low NCR if it writes off uncollected balances quickly instead of pursuing them. Together, both metrics tell the complete revenue cycle story.
What percentage of AR over 120 days is acceptable?
HFMA recommends keeping AR over 90 days below 10% of total receivables — meaning the 120+ day threshold should be even tighter, ideally below 5–8% of total AR. Beyond 120 days, claims face dramatically lower collection probability. Furthermore, beyond 180 days, most insurance AR is effectively uncollectable — timely filing windows close, payer contract provisions favor the insurer, and the administrative cost of recovery exceeds the revenue potential for smaller-balance claims (Viaante, 2026).
Track 120+ day AR separately from 91–120 day AR because the resolution strategies differ significantly. Specifically, 91–120 day claims often still have appeal options available; 120+ day claims, however, require immediate triage to determine what remains recoverable versus what needs a write-off decision.
How does Qualigenix reduce Days in AR?
Qualigenix reduces Days in AR through a full-cycle approach: front-end prevention (eligibility verification, prior authorization, 99% coding accuracy), 24–48 hour claim submission, structured 7/17/30-day follow-up cadence on all open claims, systematic denial management with root-cause resolution, monthly payer variance analysis to recover underpayments, and weekly KPI reporting with full AR aging transparency. As a result, Qualigenix achieves a 30% average AR days reduction with a 36-day average collection cycle across all specialties and payer types.
The 30% AR days reduction reflects the compound effect of multiple simultaneous improvements — faster submission, fewer denials, faster denial resolution, and underpayment recovery all working together. Practices transitioning to Qualigenix management typically see measurable AR improvement within the first 60–90 days.
Related Qualigenix Resources
Service Pages:
- Medical Accounts Receivable Services — Systematic AR follow-up, 30% reduction in AR days
- AR Follow-Up Services — 7/17/30-day cadence, nothing ages out unworked
- Denial Management Services — Root-cause resolution, stop denials from aging AR
- Claim Submission Services — 24–48 hour clean claim submission, fastest path from service to AR start
- Eligibility Verification Services — Stop eligibility denials before they add 30 days to AR
- Payment Posting Services — ERA auto-posting, accurate, fast, no reconciliation lag
- Revenue Cycle Management Services — End-to-end RCM, all AR drivers managed together
Blog Guides:
- What Is Accounts Receivable in Healthcare? Complete Guide
- RCM KPIs: Must-Track Metrics for Financial Health
- Clean Claim Rate: Benchmarks & Best Practices — How CCR drives Days in AR performance
- RCM KPI Benchmarking: Healthcare Standards for 2026
- What Are Claim Denials? Causes, Types & How to Reduce Them
- Denial Management Process: 5 Essential Steps
- How to Reduce Medical Claim Denials: 2026 Guide
- Healthcare Billing Process Explained: End-to-End Workflow
Cut Your Days in AR — Starting This Billing Cycle
Qualigenix’s AR management services apply a proven system — front-end prevention, same-day submission, structured follow-up, payer variance analysis, and root-cause denial management — to drive a 30% average reduction in AR days. With 99% claim accuracy and 6-day onboarding, your practice starts seeing results in the first 60–90 days.
Our team delivers 99% claim accuracy, a 95% first-pass acceptance rate, an average 36-day collection cycle, and a 30% reduction in AR days. We onboard in as few as 6 days, starting with an immediate AR performance assessment and aging analysis.
Precision. Progress. Qualigenix.