Why Denial Management Matters in RCM
The Qualigenix Editorial Team consists of certified billing and coding experts with over 40 years of experience across 38+ medical specialties. Our content is rigorously researched against CMS, AMA, and payer-specific guidelines to ensure total compliance and accuracy. We apply the same elite standards to our resources as we do our client work, consistently delivering high claim accuracy and significant reductions in AR days.

Every denied claim tells a story of wasted time, lost revenue, and rising frustration. Across the United States, healthcare providers are facing more claim denials than ever before. In 2023, insurance payers on the federal marketplace rejected nearly one in five in-network claims, and some plans denied more than half of the claims submitted.
Behind those medical claim denials statistics lies a bigger issue. Every denied claim slows cash flow, increases administrative costs, and leaves patients confused about what they owe. The good news is that most denials can be prevented. This guide explains how to reduce medical claim denials using a structured, five-step playbook. You will also learn how to track first-pass claim rate, use dashboards for faster decisions, and apply real-world checkpoints that keep revenue moving.
Why Denial Management Matters in RCM
Denial management is no longer a back-office task. It has become a central part of every revenue cycle strategy. When denials rise, so do rework, write-offs, and staff stress. A strong denial management process protects both the bottom line and the reputation of a healthcare organization.
Below are five key perspectives that explain why denial management matters so much today.
Escalating Denial Trends & Cost Impact
Denials have become more frequent and more expensive to fix. Studies show that healthcare organizations spend more than $25 billion each year on claims adjudication costs, and a significant part of that spending comes from reworking denials that could have been prevented. Even when a denied claim is successfully appealed, the time spent on corrections and follow-up adds up to a heavy operational cost.
Common Claim Errors Still Dominate
Most denials are not caused by complex payer rules. They start with preventable mistakes. Common claim errors include incorrect patient information, missing signatures, outdated insurance IDs, or mismatched procedure codes. Small errors in eligibility verification or coding accuracy can lead to automatic rejections. A single missed eligibility check can trigger dozens of denied claims in a week.
Payer Variability & Hard Rules
Every payer has its own playbook, and rules can change with little notice. Some payers deny 15 to 16 percent of claims, whereas others stay closer to 10 percent. Medicare Advantage plans, for example, have tightened criteria around prior authorization delays and medical necessity documentation. Without strong payer-specific edits and clear rule libraries, billing teams spend hours adjusting to shifting requirements.
Impact on AR Days and Cash Flow
Denied claims stretch the revenue cycle. They increase AR days impact, slow cash receipts, and inflate pending balances. When the accounts receivable pile grows, staff spend more time on follow-up and less on prevention. Eventually, delayed reimbursements affect operating budgets and even staffing decisions.
Patient Experience & Trust Costs
Beyond the numbers, there is a human cost. When claims are denied, patients often receive confusing bills that do not match what they expected. They may blame the provider, delay future care, or lose confidence in the billing process. Denial prevention protects the patient experience by keeping statements accurate, transparent, and easy to understand.
The 5-Step Playbook to Reduce Medical Claim Denials
Preventing denials is not about one big fix. It is about a repeatable set of small, consistent actions across the revenue cycle. This five-step playbook creates a preventive rhythm that keeps claims clean from the start.
Step 1: Verify and Authorize Early
Strong eligibility verification prevents many of the issues that appear later in billing. Run real-time checks before every appointment to confirm active coverage and benefits. Use batch sweeps for the next few days of scheduled visits so expired plans or inactive policies can be fixed ahead of time. Maintain a centralized tracker for prior authorizations with clear start and expiry dates.
Step 2: Code and Document for Clean Claims
Each medical service must be linked to the right diagnosis and documented clearly. Coding accuracy ensures that the treatment aligns with payer expectations and clinical justification. Set internal timelines for charge capture so no service slips through the cracks. Add a coding quality review for high-risk departments such as surgery or cardiology. Coders should always have access to full provider notes, not summaries. This step strengthens compliance, supports audit readiness, and improves the clean claim rate on the first submission.
Step 3: Build Smart Edits and Claim Scrubbing
Claim scrubbing is the last safety filter before submission. Use rules that reflect payer requirements and Local Coverage Determination (LCD)/National Coverage Determination (NCD) policies. A well-tuned scrubber flags issues like invalid modifiers, wrong code combinations, or missing identifiers. Always suppress unnecessary patient health information (PHI) in free-text fields to avoid rejection at clearinghouses. Make sure every file complies with EDI 837 format standards. When an insurer sends back payment data, post it accurately through Electronic Remittance Advice (ERA) and Explanation of Benefits (EOB) reconciliation.
Step 4: Monitor and Escalate Denials in Real Time
Denied claims must be tracked as they happen, not in bulk weeks later. Use dashboards that show denial analytics by category, such as eligibility, coding, or prior authorization. Create visual heatmaps of high-frequency denial codes and assign owners for follow-up. Review these insights weekly and share them across departments. The faster a denial trend is recognized, the quicker teams can correct the source. Real-time monitoring prevents small problems from becoming systemic.
Step 5: Turn Denials into Education
Organize short sessions where billing, coding, and front-desk teams review the reasons for recent denials and discuss what should change. Keep a record of these patterns in a shared folder or dashboard. When appropriate, you should appeal denials that were incorrectly issued, following a clear denial appeal process. Create a write-off policy to decide which claims are not worth repeated appeals. Turning denials into learning moments helps teams get ahead of future mistakes and steadily raises the first-pass claim rate.
Revenue Cycle KPIs: Measure What Matters
Strong denial management depends on what you measure. Data turns experience into evidence and gives teams the feedback they need to improve. The right metrics help identify where denials originate and how fast they are resolved. Here are the key revenue cycle KPIs that show the overall health of your billing process:
First-Pass or Clean Claim Rate
This is the single most important KPI in denial prevention. The first-pass claim rate shows how many claims are accepted and paid on the first submission without manual fixes. The industry benchmark is above 95 percent. Anything below that signals preventable errors, such as missing codes or outdated insurance details. Track this metric by payer and location to identify weak spots. A higher first-pass rate means fewer denials, faster payments, and lower staff workload.
Denial Rate and AR Days Impact
A low denial rate shows a clean revenue cycle. Keep initial denials below 5 percent and total denials below 8 percent. Pair this number with AR days impact to see how denials affect cash flow. Long AR days often point to rework bottlenecks or missing follow-ups. Aim for average AR days under 30 to 35. Keeping these medical claim denials statistics and numbers tight helps maintain liquidity and gives leadership a reliable forecast of incoming cash.
Appeal Turnaround and Win Rate
An efficient denial appeal process saves time and money. Track the turnaround time from denial to resolution. Measure the percentage of denials overturned and the total recovered amount. These two indicators reveal whether your appeal documentation is effective. High win rates usually reflect strong coding documentation and well-organized authorization tracking. Over time, improvements here reduce the overall volume of new denials.
DNFB (Discharged Not Final Billed)
This metric shows the delay between care delivery and claim submission. A high DNFB means revenue is stuck before billing even starts. When you maintain clear documentation and quick charge capture, DNFB days drop, and cash moves faster. Hospitals with DNFB under 10 days perform far better than those holding claims for weeks.
Denial Cost Impact
Each denial carries a measurable cost in staff time, appeal fees, and lost reimbursement opportunities. Tracking denial cost impact helps quantify what prevention saves. For example, reducing the denial rate by even two percent in a mid-size hospital can free up hundreds of thousands of dollars annually.
Build a Prevention Dashboard
Dashboards turn numbers into direction. They help teams see where attention is needed and confirm when progress is real. A denial prevention dashboard connects key metrics with clear ownership and a steady cadence for review.
Definitions and Data Hygiene
Start with clean data. Create one shared glossary for all KPIs so everyone measures metrics the same way. Lock formulas and confirm that data pulls from verified billing and clearinghouse sources. When data is clean and consistent, every meeting stays focused on action rather than reconciliation. Audit-ready dashboards also make compliance checks easier and prevent confusion between billing and finance teams.
Ownership, Thresholds, and Cadence
Assign clear ownership for every metric. For example, eligibility errors may belong to the front-desk team, while coding denials are owned by the HIM department. Set performance thresholds for each KPI. If the first-pass claim rate drops below 94 percent, it should trigger a review. Hold weekly huddles to go over red-flag metrics. Discuss what changed, what was fixed, and what needs escalation. Consistent rhythm prevents denial spikes and keeps accountability visible.
Payer Views and Trend Notes
Segment dashboards by payer or plan. This allows you to spot patterns that hide in averages. For instance, one payer may consistently delay approvals for imaging or demand specific codes for labs. Summarize these patterns in short trend notes each month. Share them with staff so everyone stays aligned with payer expectations. Over time, this builds an internal knowledge base that strengthens your denial analytics and training programs.
How Qualigenix Helps Reduce Medical Claim Denials
Even the most skilled in-house teams can struggle with scale and time. That is where Qualigenix makes the difference. We combine RCM expertise with automation and analytics to streamline the entire cycle from patient intake to payment posting.
Why Qualigenix
Qualigenix automates eligibility verification and prior authorization tracking while applying coding quality checks before claims ever reach the payer. Each claim is validated against payer-specific edits, minimizing rejection rates.
What You Get
Clients receive full-cycle support, including insurance verification, coding audits, and automated claim scrubbing. A structured denial-to-education loop ensures staff learn from every rejected claim. Dedicated AR worklists prioritize follow-ups by age, value, and payer. This structure keeps the accounts clean and revenue steady.
How We Deliver Results
With the 30-60-90 day onboarding plan, integration happens quickly and without disrupting existing systems. Live dashboards provide visibility into denial rates, AR days, and claim status from day one. Service-level agreements guarantee measurable results, such as shorter AR days and a higher clean claim rate.
Stop Chasing Denials. Start Preventing Them with Qualigenix!
Denial prevention is the foundation of a healthy revenue cycle. It keeps money flowing, reduces staff burnout, and builds trust with patients and payers alike. The path to success is simple: verify early, document completely, scrub thoroughly, and track results with discipline. When your team understands how to reduce medical claim denials and applies that knowledge daily, you turn billing from a reactive process into a proactive advantage. With partners like Qualigenix, those results become measurable, repeatable, and sustainable.
FAQs
1. What is a realistic first pass claim rate target?
A realistic first pass claim rate target is 95 percent or higher. Performance should be tracked by payer and specialty to pinpoint gaps where training, documentation, or workflow updates are required.
2. Which denials should be fixed first?
Priority should be given to denials with high dollar value and high volume. Addressing the top three denial reasons each week produces faster financial impact and improves short term cash flow.
3. How do we measure appeal effectiveness?
Appeal effectiveness is measured by turnaround time, overturned percentage, and recovered revenue. These metrics show whether appeals are submitted quickly, supported by proper documentation, and generating real financial recovery.
4. Where does automation deliver the most impact?
Automation delivers the most impact in eligibility verification, authorization requests, claim status tracking, and ERA posting. These repetitive tasks benefit from speed, accuracy, and consistency, reducing manual workload and delays.
5. How soon should results appear?
Most organizations see measurable improvement within 60 to 90 days. Regular reviews, weekly team check ins, and clear KPI ownership lead to fewer denials and faster collections within this timeframe.
What’s Next
Medical Coding Errors That Cost Practices the Most (And How to Catch Them Before They Submit)
Medical Coding Errors That Cost Practices the Most (And How to Catch Them Before They Submit) Written by the...
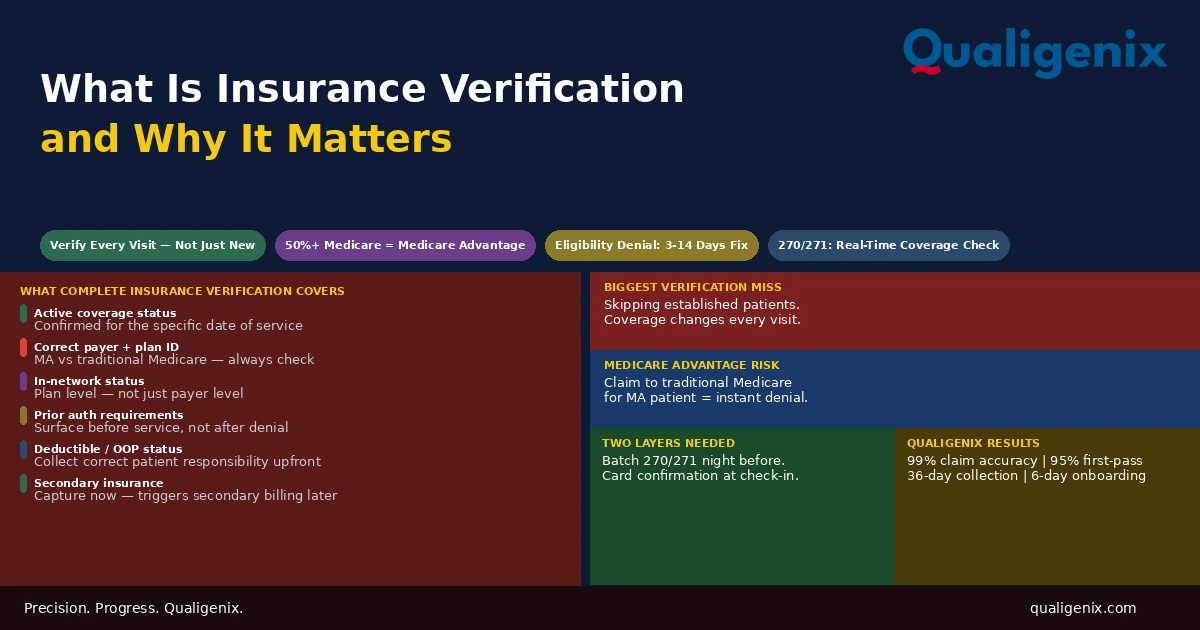
What Is Insurance Verification and Why It Matters
Insurance verification is the front-end process that determines whether a claim will be paid before the patient ever enters...
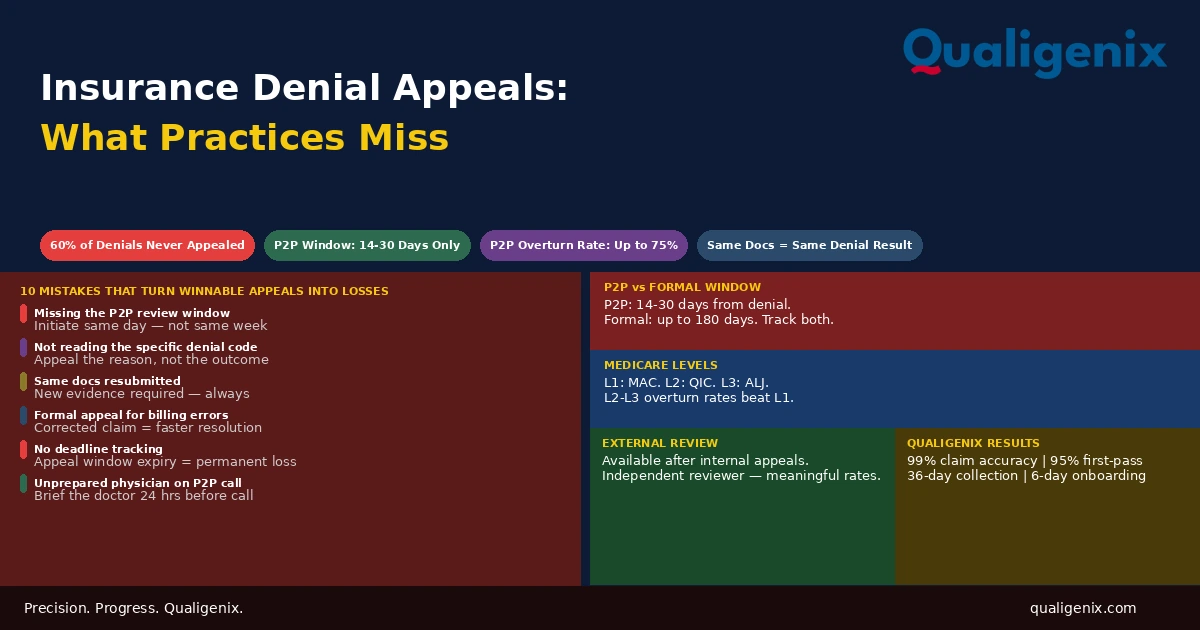
Insurance Denial Appeals: What Practices Miss
Most insurance denial appeals that fail don’t fail because the clinical case was weak. They fail because the...