Benchmarking Your RCM KPIs Against Industry Standards
The Qualigenix Editorial Team consists of certified billing and coding experts with over 40 years of experience across 38+ medical specialties. Our content is rigorously researched against CMS, AMA, and payer-specific guidelines to ensure total compliance and accuracy. We apply the same elite standards to our resources as we do our client work, consistently delivering high claim accuracy and significant reductions in AR days.

RCM KPI benchmarking tells you exactly where your revenue cycle is underperforming — and by how much. In 2026, the key benchmarks are: Days in AR under 35 days (top performers at 28–32), clean claim rate above 95%, denial rate below 5–8%, net collection rate above 95–96%, first-pass resolution rate above 85%, and cost to collect below 3%. Qualigenix clients consistently outperform these benchmarks with 99% claim accuracy, 95% first-pass acceptance, and a 30% reduction in AR days — with 6-day average onboarding.
You cannot improve what you do not measure — and you cannot measure accurately without the right benchmarks. Healthcare practices that actively track revenue cycle management KPIs against industry standards consistently outperform those that don’t, often by 20–30% in revenue recovery (Healix RCM). Yet most practices either track the wrong metrics, benchmark against themselves rather than the industry, or review data too infrequently to intervene before performance gaps compound.
In 2026, the stakes are higher. Denial rates are rising — the industry average hit 11.8% in 2024, up from 10.2% in prior years. Payers use AI to review claims more aggressively. Patient responsibility continues to grow as high-deductible health plans dominate. In this environment, a practice that benchmarks its clean claim rate only against last quarter’s performance may not realize it is falling further behind industry leaders every month.
This guide covers the most important RCM KPI benchmarks for healthcare in 2026 — what each metric means, how to calculate it, where the industry bar sits, where top performers land, and what a gap between your performance and the benchmark actually costs your practice in dollar terms. At the end, you will have a complete framework for healthcare KPI benchmarking that drives real financial improvement. See how Qualigenix’s revenue cycle management services help practices reach — and sustain — best-in-class performance.
What Is RCM KPI Benchmarking in Healthcare?
RCM KPI benchmarking in healthcare is the process of measuring a practice’s revenue cycle performance metrics — such as days in AR, clean claim rate, denial rate, and net collection rate — against established industry standards to identify performance gaps, prioritize improvement efforts, and track progress over time. Effective benchmarking compares metrics by specialty, payer, and provider — not just as aggregate practice-wide averages.
Benchmarking works as a diagnostic tool. When your denial rate is 14% and the industry average is 8%, you know something specific is failing — and the gap tells you how urgently it needs to be fixed. When your AR days are 52 and top performers sit at 28–32, you can calculate the exact dollar impact of that gap and build a business case for intervention. Without benchmarks, you are navigating revenue performance without a map.
The most impactful benchmarking is granular. A practice-wide denial rate of 9% may look acceptable against the 11.8% average — until you break it down by payer and discover that a single commercial plan is denying 22% of your claims due to a local coverage determination change your team missed. Aggregate benchmarks tell you there is a problem; granular benchmarks tell you exactly where.
2026 RCM KPI Benchmarks: Industry Standards at a Glance
| KPI / Metric | Industry Benchmark / Value |
|---|---|
| Days in AR — Industry Average | 33–42 days (MGMA DataDive) |
| Days in AR — Good Performance | 35–42 days |
| Days in AR — Top Tier (Best in Class) | 28–32 days |
| Days in AR — Qualigenix Average | 36 days (30% reduction for clients) |
| Clean Claim Rate — Minimum Target | 95% |
| Clean Claim Rate — Top Performers | 98%+ |
| Clean Claim Rate — Qualigenix | 99% claim accuracy (95% first-pass acceptance) |
| Denial Rate — Industry Average (2026) | 11.8% (HFMA) |
| Denial Rate — Good Performance | Below 8–10% |
| Denial Rate — Best in Class | Below 5% |
| Net Collection Rate — Good Performance | 95%+ |
| Net Collection Rate — Top Tier | 96–98% |
| First-Pass Resolution Rate — Industry Average | 70–85% (HFMA) |
| First-Pass Resolution Rate — Target | 85%+ |
| First-Pass Resolution Rate — Qualigenix | 95% |
| Cost to Collect — Industry Standard | 3.3% of net patient revenue (Akasa) |
| Cost to Collect — Target | Below 3% |
| AR Over 120 Days — Red Flag Threshold | More than 25% of total AR |
| Charge Lag — Best Practice | Under 72 hours from service to charge entry |
What Are the Most Important RCM KPIs to Benchmark in 2026?
Revenue cycle performance data can be sliced dozens of ways, but most practices get the highest ROI from focusing on seven core KPIs. Each one directly measures a different failure point in the revenue cycle — and each has clear industry benchmarks to compare against.
KPI 1: Days in Accounts Receivable (AR Days)
Days in AR is the single most watched RCM metric — and for good reason. It tells you how long, on average, it takes your practice to collect payment after a service is rendered. Every day your AR extends beyond benchmark is a day of earned revenue sitting unpaid, compounding cash flow pressure and increasing the risk that claims become unrecoverable.
Formula: Total Accounts Receivable ÷ Average Daily Charges = Days in AR
A practice with $2,000,000 in total AR and $50,000 in average daily charges has 40 days in AR. According to MGMA DataDive, the median is 33–42 days by specialty. Top performers reach 28–32 days. If your practice runs at 50 days and could improve to 35, that 15-day reduction at $50,000 average daily charges releases $750,000 in accelerated cash flow.
- Industry Average: 33–42 days (MGMA DataDive 2023)
- Good Performance: 35–40 days
- Best in Class: 28–32 days
- Qualigenix: Clients average 36 days with a 30% reduction from baseline
- Primary Causes of High AR Days: Slow claim submission, high denial rates, insufficient payer follow-up, poor eligibility verification at front-end
KPI 2: Clean Claim Rate (CCR)
The clean claim rate measures what percentage of your claims clear payer adjudication on first submission without edits, corrections, or additional information requests. It is the upstream quality indicator that predicts everything downstream — denial rate, AR days, cost to collect, and first-pass resolution.
Formula: (Number of Clean Claims ÷ Total Claims Submitted) × 100
The most common causes of low clean claim rates are eligibility verification failures, coding errors, missing or incorrect modifiers, outdated payer IDs, and demographic data entry mistakes. Each of these is preventable with front-end controls — which is why clean claim rate is the metric most directly improved by strong pre-submission review processes.
- Industry Target: 95%+ (HFMA, Advisory Board)
- Top Performer Benchmark: 98%
- Qualigenix: 99% claim accuracy through specialty-trained coding review and pre-submission scrubbing
- Dollar Impact: Each percentage point improvement in CCR at 500 claims/month × $300 average prevents 5 claims from requiring rework, saving $75–$900 in rework cost per month
KPI 3: Denial Rate
The denial rate is the percentage of submitted claims that payers reject on first adjudication. In 2026, it is moving in the wrong direction for most practices. The industry average hit 11.8% in 2024 (HFMA), up from 10.2% a few years earlier. For specialty care practices facing complex payer rules, denial rates can exceed 20%.
Formula: (Number of Denied Claims ÷ Total Claims Submitted) × 100
The financial cost of high denial rates compounds quickly. Each reworked claim costs $25–$181 in administrative labor. Denied claims that miss appeal deadlines become write-offs. And 86% of all denials are preventable — meaning the majority of denial-related cost is avoidable with better front-end controls and coding accuracy.
- Industry Average: 11.8% (HFMA 2024)
- Good Performance: Below 8–10%
- Best in Class: Below 5%
- Qualigenix: Clients maintain denial rates well below industry average through 95% first-pass acceptance
- Top Denial Root Causes: Missing prior authorization, coding errors, eligibility issues, timely filing failures, medical necessity documentation gaps
KPI 4: Net Collection Rate (NCR)
The net collection rate is the most comprehensive measure of your revenue cycle’s overall effectiveness. It measures how much of the revenue you are contractually entitled to collect — after adjusting for contractual write-offs — your practice actually receives. A net collection rate of 96% means you are collecting 96 cents of every dollar you are owed under your payer contracts.
Formula: (Total Payments Received ÷ Net Revenue Billed) × 100
- Industry Standard: 96% (Advisory Board, MGMA)
- Top Performer Benchmark: 98%
- Red Flag Threshold: Below 90% — suggests systemic billing gaps or write-off practices that mask revenue loss
- Primary Causes of Low NCR: Unworked denials becoming write-offs, inaccurate contractual adjustments, poor patient collection processes, missed timely filing deadlines
KPI 5: First-Pass Resolution Rate (FPRR)
First-pass resolution rate measures the percentage of claims that are paid — not just submitted clean — on their first attempt without requiring rework, appeals, or resubmission. It differs from clean claim rate by including the payer’s adjudication outcome.
Formula: (Claims Paid on First Submission ÷ Total Claims Submitted) × 100
- Industry Average: 70–85% (HFMA)
- Target: 85%+
- Qualigenix: 95% first-pass acceptance rate — significantly above industry average
- Gap Impact: Each percentage point below 85% means additional claims requiring rework, appeal management, and delayed cash flow at scale
KPI 6: AR Over 120 Days
The percentage of your accounts receivable more than 120 days old is one of the clearest warning signals in healthcare revenue cycle management. Claims this old are significantly harder to collect. Commercial payers have contractual appeal windows; once those close, the revenue is permanently lost.
This metric must be tracked separately for payer AR and patient AR, as the collection strategies differ. Payer AR over 120 days signals missed appeal deadlines or insufficient follow-up. Patient AR over 120 days signals insufficient patient payment communication or collections workflow.
- Industry Red Flag: More than 25% of total AR aging over 120 days
- Best Practice Target: Less than 15% of total AR over 120 days
- Qualigenix Response: Our AR follow-up services include automated aging triggers that escalate unpaid claims well before the 120-day threshold
KPI 7: Cost to Collect
Cost to collect measures the total administrative expense required to bring in one dollar of revenue — including billing staff labor, technology, clearinghouse fees, and denial management overhead. In 2026, the median has plateaued at 3.3% of net patient revenue (Akasa), largely because of increased labor spend and growing administrative complexity from payer rules.
Formula: Total Billing and Collection Costs ÷ Total Revenue Collected
- Industry Median: 3.3% of net patient revenue (Akasa)
- Target: Below 3%
- Outsourced RCM Advantage: Specialized partners typically achieve lower cost-to-collect ratios by eliminating in-house overhead — staff, software, training — and operating at scale
How Do You Calculate the Cost of a 1% Gap in Your Denial Rate?
To calculate the dollar cost of a denial rate gap, multiply your total monthly claims volume by the percentage gap, then by your average claim value, then by 5% — the approximate revenue at risk from unrecovered denials. Example: A practice submitting 1,000 claims/month at $400 average with a 12% denial rate has $48,000 at risk monthly. If 15% of those denials become write-offs, that is $7,200 in permanent monthly revenue loss — $86,400 annually. Reducing the denial rate by 3 percentage points (to 9%) recovers approximately $25,920 annually.
RCM KPI Benchmarks by Specialty: How Does Your Practice Compare?
KPI benchmarks are not one-size-fits-all. Specialty, payer mix, and practice size all affect what performance looks like. Here are benchmark ranges by specialty category, sourced from MGMA DataDive and HFMA specialty benchmarking data:
| Specialty Category | Days in AR | Clean Claim Rate | Denial Rate | Net Collection Rate |
|---|---|---|---|---|
| Primary Care / Family Medicine | 28–35 days | 96%+ | 5–8% | 96–98% |
| Orthopedics / Surgery | 35–45 days | 93–96% | 8–12% | 94–97% |
| Behavioral Health | 40–55 days | 88–93% | 12–18% | 90–94% |
| DME Suppliers | 45–60 days | 85–92% | 15–22% | 88–93% |
| Home Health Agencies | 40–55 days | 88–94% | 10–16% | 91–95% |
| Cardiology | 35–45 days | 93–96% | 8–13% | 94–97% |
| Oncology | 40–55 days | 90–94% | 12–18% | 92–96% |
| Radiology / Imaging | 30–40 days | 94–97% | 6–10% | 95–97% |
How Often Should a Healthcare Practice Review Its RCM KPIs?
Core RCM KPIs — days in AR, denial rate, and clean claim rate — should be reviewed at minimum monthly, with weekly snapshots for practices managing high claim volume or experiencing known performance gaps. AR aging and denial rate by payer should be reviewed weekly when AR days are above 40 or denial rate is above 8%, because these metrics signal active problems that compound quickly without intervention.
Annual reviews are insufficient — by the time an annual report surfaces a performance gap, months of revenue leakage have already occurred. Most high-performing practices set KPI review cadences into their calendar: weekly denial trend reviews, monthly benchmarking against industry standards, and quarterly deep-dive audits by provider and payer.
How Do You Build an RCM KPI Benchmarking Program From Scratch?
Most practices have the raw data they need for benchmarking — it lives in their practice management system, clearinghouse reports, and ERA/EOB files. The challenge is extracting it, organizing it, and comparing it against meaningful external benchmarks in a consistent cadence. Here is a practical four-step framework:
- Step 1 — Define Your Baseline: Pull the last 90 days of data for each core KPI. Calculate your current days in AR, denial rate, clean claim rate, net collection rate, and first-pass resolution rate. This is your starting point — without it, you cannot measure improvement.
- Step 2 — Select the Right Benchmarks: Use specialty-specific benchmarks, not general healthcare averages. MGMA DataDive, HFMA, and Advisory Board all publish specialty-level benchmarks annually. Match your specialty and payer mix to the most relevant reference data.
- Step 3 — Segment by Payer and Provider: Practice-wide averages hide the most important insights. A 9% overall denial rate may be hiding a 20% denial rate with a single commercial payer. Break every KPI down by payer, provider, and procedure category to find the specific gaps driving underperformance.
- Step 4 — Build a Monthly Review Cadence: Assign KPI ownership to specific team members. Review benchmarks monthly in a structured format — not just when problems surface. Track trendlines, not just point-in-time values, to catch deteriorating performance early.
What Is a Good RCM Efficiency Score and How Do You Calculate It?
A composite RCM Efficiency Score combines your four primary KPIs into one performance index. Score each KPI against its benchmark, average the scores, and interpret the result. Days in AR score = (35 ÷ actual days) × 100; Clean Claim Rate score = (actual rate ÷ 95) × 100; Denial Rate score = (5 ÷ actual rate) × 100; Net Collection Rate score = (actual rate ÷ 96) × 100. Average those four scores. Above 90 = excellent; 80–89 = good; 70–79 = average; below 70 = significant underperformance.
This single number gives practice leadership a quick read on overall revenue cycle health without requiring deep data analysis every time. It works best as a monthly snapshot metric alongside the granular payer- and provider-level breakdowns that drive operational decisions.
How Qualigenix Helps Your Practice Outperform RCM Benchmarks
Qualigenix provides every client with real-time RCM dashboards that track all core KPIs against industry benchmarks — not just your own historical performance. Our revenue cycle management services are built around measurable benchmark targets, and every engagement begins with a baseline assessment that identifies exactly which KPIs are underperforming and by how much.
- 99% Claim Accuracy: Our pre-submission coding review and payer-specific edit scrubbing delivers 99% claim accuracy — the foundation of a 95% first-pass acceptance rate that outperforms the 70–85% industry average.
- 30% AR Days Reduction: Clients consistently reduce days in AR by 30% from baseline within the first 90 days of engagement — moving from above-average to best-in-class performance through faster claim submission, proactive payer follow-up, and denial prevention.
- 36-Day Average Collection Cycle: Our 36-day average collection cycle positions clients at the top tier of industry benchmarks, compared to the 33–42 day median and the 50+ day performance of practices with unmanaged revenue cycles.
- Specialty-Specific Benchmarking: We benchmark your performance against specialty peers — not generic healthcare averages — because a behavioral health practice has fundamentally different benchmarks than a cardiology group. Our teams are trained by specialty to identify the specific payer rules and coding patterns driving your gaps.
- 6-Day Onboarding: Most practices are fully operational with Qualigenix in six business days, with an immediate AR assessment that identifies your highest-priority KPI gaps from day one.
10-Point RCM KPI Benchmarking Checklist for Healthcare Practices
- ☐ Days in AR Tracked Monthly: Are you calculating and reviewing AR days monthly — by payer and by provider, not just practice-wide?
- ☐ Clean Claim Rate Above 95%: Is your first-pass submission quality at 95% or above? Do you know which payers or procedure categories are pulling it down?
- ☐ Denial Rate Below 8%: Is your denial rate benchmarked against your specialty average — not just the general healthcare industry rate?
- ☐ Net Collection Rate Above 95%: Are you measuring net collection rate separately from gross collection rate to identify contractual adjustment accuracy?
- ☐ First-Pass Resolution at 85%+: Is your first-pass resolution rate tracked against the HFMA benchmark, and do you know which denial categories are reducing it?
- ☐ AR Over 120 Days Below 25%: Is your AR aging report segmented by payer and patient, and are you acting on claims before the 120-day threshold?
- ☐ Cost to Collect Below 3%: Have you calculated your actual cost to collect — including staff, technology, and overhead — and compared it against the 3.3% industry median?
- ☐ Specialty Benchmarks Used: Are you using specialty-specific KPI benchmarks from MGMA or HFMA — not just general healthcare averages that may not reflect your payer mix?
- ☐ Weekly Denial Trend Review: Is denial rate reviewed weekly by payer and procedure category — not just monthly — to catch deteriorating trends before they compound?
- ☐ Quarterly Provider-Level Audit: Do individual providers receive quarterly feedback on their coding accuracy, denial rate, and documentation quality against peer benchmarks?
Frequently Asked Questions: RCM KPI Benchmarking in Healthcare
What are the most important RCM KPIs for healthcare practices?
The seven most important RCM KPIs are: Days in Accounts Receivable, Clean Claim Rate, Denial Rate, Net Collection Rate, First-Pass Resolution Rate, AR Over 120 Days, and Cost to Collect. These seven metrics cover every major failure point in the revenue cycle — from front-end submission quality through collections and write-off management.
Tracking all seven monthly, broken down by payer and provider, gives practice leadership a complete picture of revenue cycle health and reveals the specific gaps with the highest financial impact.
What is a good days in AR benchmark for healthcare?
For most healthcare practices, days in AR below 35 is strong performance; top-performing practices operate at 28–32 days. The industry median sits at 33–42 days depending on specialty (MGMA DataDive). Any practice consistently above 50 days in AR has significant billing process issues that are actively compounding cash flow pressure.
Qualigenix clients average 36 days in AR and reduce their baseline by 30% within the first 90 days of engagement — delivering both benchmark-level performance and measurable improvement from their starting point.
What clean claim rate should I target?
Target a minimum clean claim rate of 95%, with best-in-class performance at 98%+. Qualigenix delivers 99% claim accuracy through specialty-trained coding review and payer-specific pre-submission scrubbing. Clean claim rate is the most upstream quality metric — improving it reduces denial rate, lowers cost to collect, and shortens AR days simultaneously.
What is the industry average denial rate in 2026?
The industry average denial rate in 2026 is 11.8% — up from 10.2% in prior years, according to HFMA. For complex specialty care, denial rates can exceed 20%. Best-in-class practices maintain denial rates below 5% through proactive denial prevention workflows, real-time eligibility verification, and pre-submission coding accuracy.
Qualigenix clients consistently outperform the industry average through a 95% first-pass acceptance rate and root-cause denial analytics that fix upstream workflow failures rather than just appealing individual claims.
How do I benchmark my RCM KPIs against specialty peers?
To benchmark against specialty peers, use MGMA DataDive, HFMA specialty benchmarking reports, and Advisory Board published metrics — all of which segment KPI benchmarks by specialty category. Pull your last 90 days of performance data for each core KPI, then compare against the specialty-specific range — not the general healthcare average.
Qualigenix provides every client with specialty-specific benchmark comparisons built into their real-time performance dashboards, so you’re always measuring against the right peer group.
What does a 1% improvement in clean claim rate mean for my practice?
For a practice submitting 1,000 claims per month at an average of $350 per claim, a 1% improvement in clean claim rate means 10 fewer claims requiring rework each month — saving $250–$1,810 in monthly administrative costs, plus faster payment on those 10 claims, typically 15–30 days sooner.
At the AR level, moving from 50 days to 40 days in AR at $50,000 average daily charges releases $500,000 in accelerated cash flow. These numbers illustrate why benchmarking is not an academic exercise — it is a direct path to quantified revenue improvement.
How does Qualigenix improve my RCM KPIs?
Qualigenix improves RCM KPIs through specialty-trained billing expertise, AI-powered pre-submission coding review, real-time eligibility verification, proactive denial management, and real-time performance dashboards benchmarked against industry standards. Every engagement starts with a free AR assessment that identifies your highest-priority KPI gaps. Clients average a 30% reduction in AR days, 95% first-pass acceptance rate, and 99% claim accuracy — within 6 business days of onboarding.
Related Qualigenix Resources
Service Pages:
- Revenue Cycle Management Services — End-to-end RCM built around measurable KPI benchmarks
- Denial Management Services — Cut your denial rate to below-benchmark levels
- AR Follow-Up Services — Reduce AR days and recover aged claims before write-offs
- Medical Accounts Receivable Services — Specialty AR management for faster collections
- Healthcare Performance Reporting — Real-time dashboards for all core RCM KPIs
- Medical Billing Outsourcing Services — Full-service RCM with built-in KPI benchmarking
Blog Guides:
- What Are RCM KPIs? Foundational guide to understanding revenue cycle metrics
- Revenue Integrity in Healthcare: 8 Key Components
- How to Select the Best Denial Management Service
- Charge Capture in Healthcare: Common Errors and Fixes
- How to Reduce Medical Claim Denials: Your 2026 Guide
- What Is a Clean Claim Rate? Benchmarks & Best Practices
- Denial Management Process: 5 Essential Steps
- What Is Revenue Cycle Management? A Beginner’s Guide
Know Where You Stand — Get a Free RCM KPI Assessment
Qualigenix provides every new client with a complimentary AR assessment that benchmarks your current KPIs against specialty-specific industry standards — and identifies your highest-priority improvement opportunities from day one.
We average 6-day onboarding, 99% claim accuracy, a 95% first-pass acceptance rate, and a 30% reduction in AR days. Your KPI gaps are costing your practice real revenue every month — and we can tell you exactly how much on Day 1.
Precision. Progress. Qualigenix.
What’s Next

Medical Coding Errors That Cost Practices the Most (And How to Catch Them Before They Submit)
Medical Coding Errors That Cost Practices the Most (And How to Catch Them Before They Submit) Written by the...
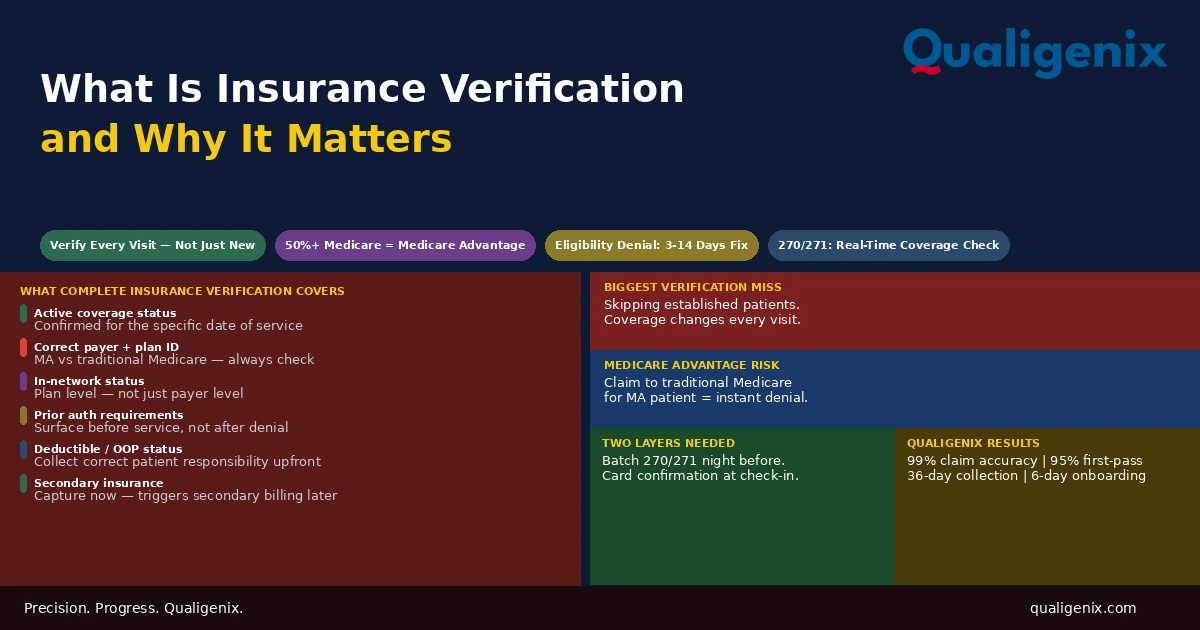
What Is Insurance Verification and Why It Matters
Insurance verification is the front-end process that determines whether a claim will be paid before the patient ever enters...
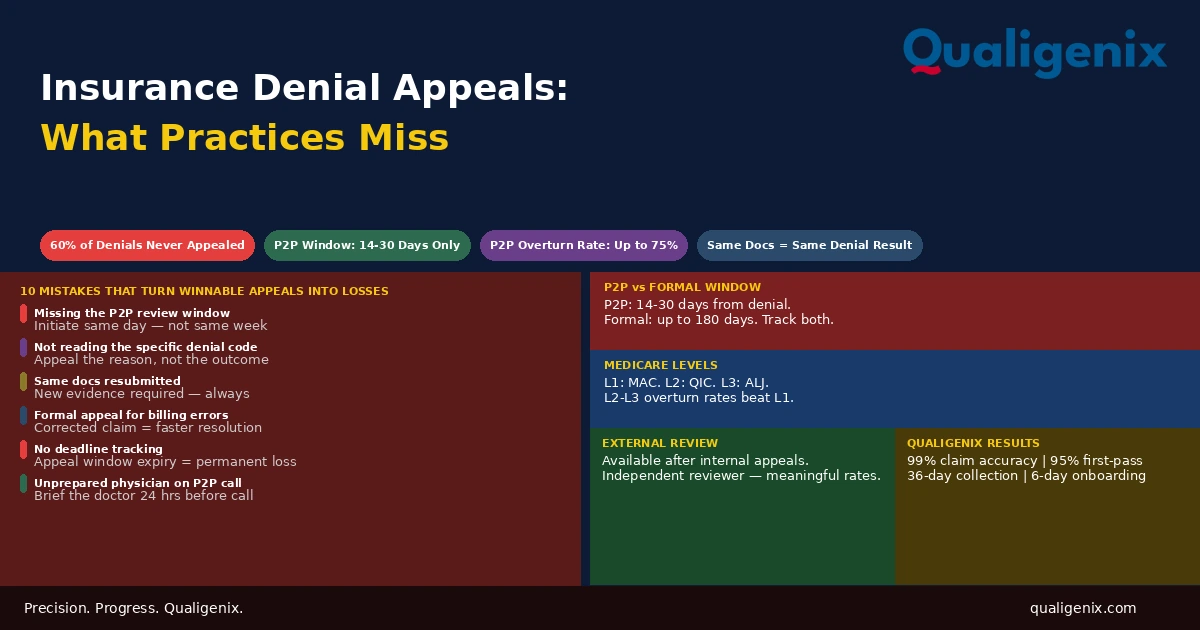
Insurance Denial Appeals: What Practices Miss
Most insurance denial appeals that fail don’t fail because the clinical case was weak. They fail because the...