Leveraging Advanced Analytics in Revenue Cycle Management
The Qualigenix Editorial Team consists of certified billing and coding experts with over 40 years of experience across 38+ medical specialties. Our content is rigorously researched against CMS, AMA, and payer-specific guidelines to ensure total compliance and accuracy. We apply the same elite standards to our resources as we do our client work, consistently delivering high claim accuracy and significant reductions in AR days.

Hospitals lose an estimated 11.8% of net revenue every year to preventable denials. Some reports suggest that about 65% of denied claims never get resubmitted, even though 90% of them are recoverable with the right intervention. If most revenue loss is avoidable, why are so many billing teams still reacting after the damage is done?
Because they’re buried in spreadsheets and static reports.
What if every claim at risk could be spotted before it became uncollectible? What if your team didn’t need to guess which payer is slowing down cash flow this week?
That’s where revenue cycle analytics comes in. Instead of waiting for month-end reports, teams work off real-time RCM data insights, like AR aging views, denial trend modeling, and automated alerts that trigger action before revenue escapes.
This blog breaks down how revenue cycle analytics moves billing from hindsight to foresight using dashboards, forecasting models, and measurable process triggers.
What Analytics Means in RCM Today?
Most RCM teams already track metrics. The problem isn’t the availability of data, it’s usability. Data stored in spreadsheets or month-end reports can only answer one question: what happened?
Modern revenue cycle analytics should answer a different one: what should we do next? That shift defines the difference between passive reporting and active decision support.
Older reporting methods show denial counts or AR aging snapshots without direction. Newer tools interpret patterns and flag action, like follow up on stalled claims, reassign workloads, or escalate payer delays. Instead of waiting for leadership meetings to review trends, frontline staff can intervene immediately.
Every analytics program pulls from recurring data sources, but the value comes from how consistently they are tracked and compared. The core domains include:
- Claims volume and status movement across the cycle
- Denial rate and root-cause tags collected from payer responses
- AR aging segmented by payer and time bucket
- Net collection rate and cost-to-collect are tracked per claim type
Real impact shows when insights trigger action. High payer response delays? Move more staff toward that queue. AR hitting 60+ days with no activity? Trigger an automated follow-up. Analytics should act less like a scoreboard and more like a workflow engine.
Core Analytics Use Cases for RCM

The value of revenue cycle analytics isn’t in dashboards alone. Real improvement happens when each insight translates into measurable action. Below are the areas where analytics consistently drives faster collections and fewer write-offs.
1. AR Aging and Trend Forecasting
AR aging reports are often static and backward-looking. With real-time views, billing teams can see which payer buckets are creeping toward write-off territory. Trend forecasting helps predict future slowdowns based on current backlog volume, seasonality, and payer activity. Instead of reacting to rising AR days, teams can staff ahead of them.
2. Denial Pattern and Root Cause Analysis
Denials aren’t random; rather, they follow patterns. Analytics helps group denials by payer, procedure code, and denial reason. Once the pattern is visible, teams can apply fixes at the source rather than reworking claims one by one. Appeal success rates can highlight which denials are worth pursuing versus which ones should be prevented entirely.
3. Payer Performance Benchmarking
Not all payers process claims with the same efficiency. Some clear 90% of claims on the first pass, others drag into weeks of back-and-forth. Benchmarking tools compare payer turnaround times, first-pass acceptance percentages, and adjustment behavior. With proof in hand, negotiation becomes easier and follow-up strategies become more structured.
4. Charge Leakage and Missed Billing Detection
Clinical documentation doesn’t always make it into billing. When that happens, revenue disappears silently. Analytics tools reconcile charges against clinical activity logs to identify documentation gaps or coding omissions. Every recovered procedure or modifier restores lost cash without adding more volume.
5. Staff Productivity and Work Queue Optimization
High workloads don’t always mean high output. Task-level analytics reveals where staff effort stalls, like extended review time, repeated touches, or claims sitting untouched. Once visible, work queues can be sequenced by impact, not by arrival order, so high-dollar claims get cleared first.
Building Effective RCM Dashboards and KPI Visualizations
Dashboards fail when they display too much data without directing attention. A good revenue cycle analytics setup doesn’t just display metrics. It guides decisions. Every KPI must answer either where cash is stuck or what needs attention right now.
So, start with indicators that reflect financial health and operational speed. The core metrics include:
- Clean claim rate
- AR days split by payer and age bucket
- Denial rate by reason code
- Net collection rate vs allowed amount
- Cost-to-collect per transaction
These numbers should not sit in reports; instead, they should trigger action.
Then, you need to decide on the visual tools. The best dashboards don’t rely on manual interpretation. Instead of raw tables, you can use:
- Heatmaps to expose denial clusters
- Trend lines to show rising AR before it spikes
- Comparative charts to rank payer performance
If one team calculates AR days differently from another, the dashboard loses trust. KPI definitions must be standardized across departments and systems. One source of truth prevents debate and promotes action.
Also, not every metric needs live streaming. Claim submission status and high-dollar AR follow-ups benefit from real-time visibility. Cost-to-collect or denial mix can refresh daily without impacting decisions. Matching refresh speed with urgency keeps dashboards lean and usable.
Predictive and Prescriptive Analytics: The Next Frontier
Once reporting and dashboards are in place, the next step is letting the system recommend actions. That’s where predictive and prescriptive models transform revenue cycle analytics from a tracking function into a decision engine.
1. Predict Denials Before They Happen
Machine learning models can scan past claim history, payer behavior, and coding patterns to flag high-risk submissions before they go out the door. Instead of fixing denials after the fact, teams correct them while still in draft.
2. Cash Flow Forecasting
Collections no longer need to be estimated with guesswork. Forecasting tools compare payer mix, aging velocity, and historical reimbursement timing to estimate upcoming deposits. Finance teams gain visibility over expected inflows and can plan expenses accordingly.
3. Automated Recommendations
Analytics shouldn’t stop at “what’s wrong.” It should suggest what to do next. If AR exceeds a set threshold, the system can reprioritize queues and push high-dollar claims to the top. If denial patterns spike for a specific code, coding guidance can trigger instantly.
4. Alerting and Workflow Triggers
Waiting for meetings to discuss performance delays. Smart alerts notify teams when denial rates exceed tolerance or when specific payer buckets stagnate. Instead of monitoring dashboards all day, staff simply respond to targeted prompts.
Implementation Roadmap & Change Management
A structured rollout keeps RCM analytics from becoming another unused dashboard. The goal is to drive measurable improvements, not just replace spreadsheets with charts. Each phase should produce visible operational wins before expanding further.
1. Start with a Baseline & Use Case Focus
Begin by reviewing denial patterns, reimbursement delays, or high-touch AR queues. Select two or three problems where improvement can be quantified in dollars or labor hours saved.
2. Clean Data & Source Integration
Consistent payer names, standardized CPT groupings, and unified provider identifiers are non-negotiable. Any mismatch between EHR and billing systems will break downstream reporting.
3. Build Iteratively & Validate with Users
Launch a starter dashboard for a small team. Collect real usage feedback, revise filters, remove noise, and only then release it to wider departments.
4. Train, Coach & Embed Analytics Into Daily Workflow
Provide quick-reference playbooks that explain what each trend means and how to respond. Managers should review key reports during daily huddles or weekly AR reviews.
How Qualigenix Leverages Revenue Cycle Analytics to Improve Outcomes?

Static monthly reports no longer cut it. Providers need dynamic visibility into denials, reimbursement velocity, and payer behavior, delivered in formats teams actually use. We combine domain expertise with modern analytics tooling to make that possible.
Our RCM specialists and data engineers work hand-in-hand to map complex billing workflows into actionable dashboards. Every report aligns with real financial KPIs, not vanity metrics.
You get access to real-time denial monitoring, AR aging projections, payer performance benchmarking, and early warning alerts when trends shift. Clients consistently see faster collection cycles, 15–20% fewer reworked claims, and higher first-pass acceptance rates within the first 30 days of implementation.
Conclusion
Revenue cycle analytics shifts billing teams from chasing problems to preventing them. Instead of waiting for denials or write-offs, dashboards and predictive signals help identify risk before revenue slips away. If you’re serious about improving margins without adding headcount, now is the time to operationalize data. Qualigenix brings the tools, workflows, and support to build a truly analytics-led RCM program.
FAQs
1. What AR days target should I aim for?
Most organizations work toward staying under 40 days, but comparing against similar specialties provides better context.
2. How accurate are predictive denial models?
With structured historical claims data, models commonly reach over 80% accuracy in predicting denials.
3. Can small practices benefit from analytics?
Absolutely. Even basic dashboards help smaller teams flag stalled claims and recover missed revenue.
4. How often should dashboards refresh?
High-priority indicators like denials or AR spikes should update hourly, while trend metrics can update daily.
5. What ROI can I expect?
Most practices reclaim lost revenue within three to six months once analytics becomes part of daily operations.
What’s Next

Medical Coding Errors That Cost Practices the Most (And How to Catch Them Before They Submit)
Medical Coding Errors That Cost Practices the Most (And How to Catch Them Before They Submit) Written by the...
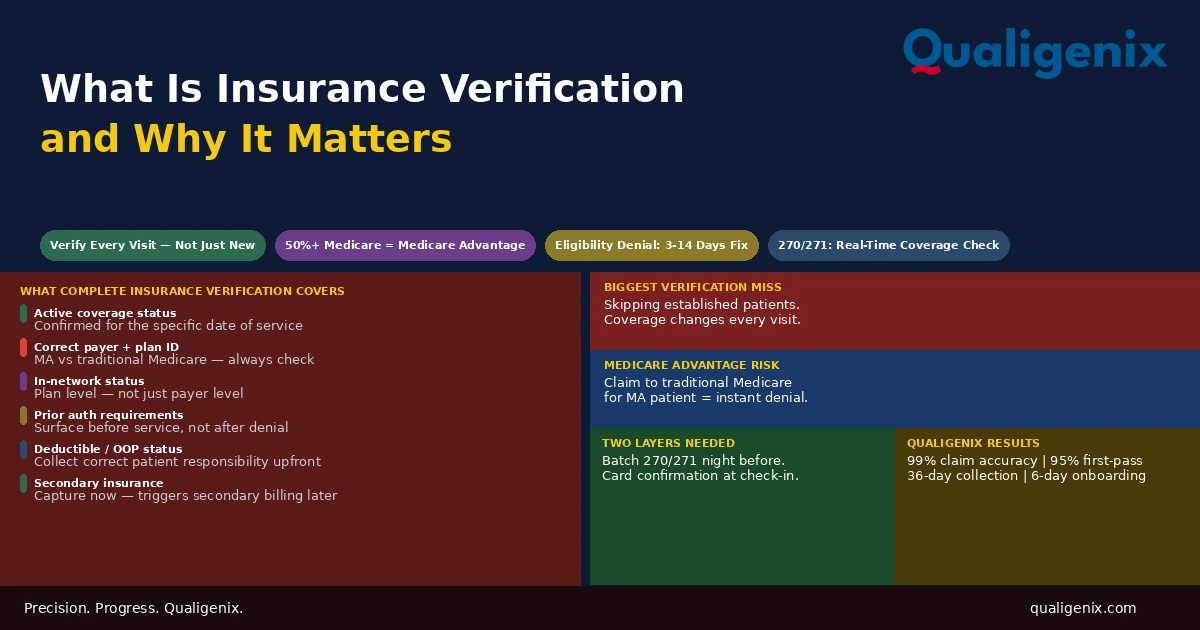
What Is Insurance Verification and Why It Matters
Insurance verification is the front-end process that determines whether a claim will be paid before the patient ever enters...
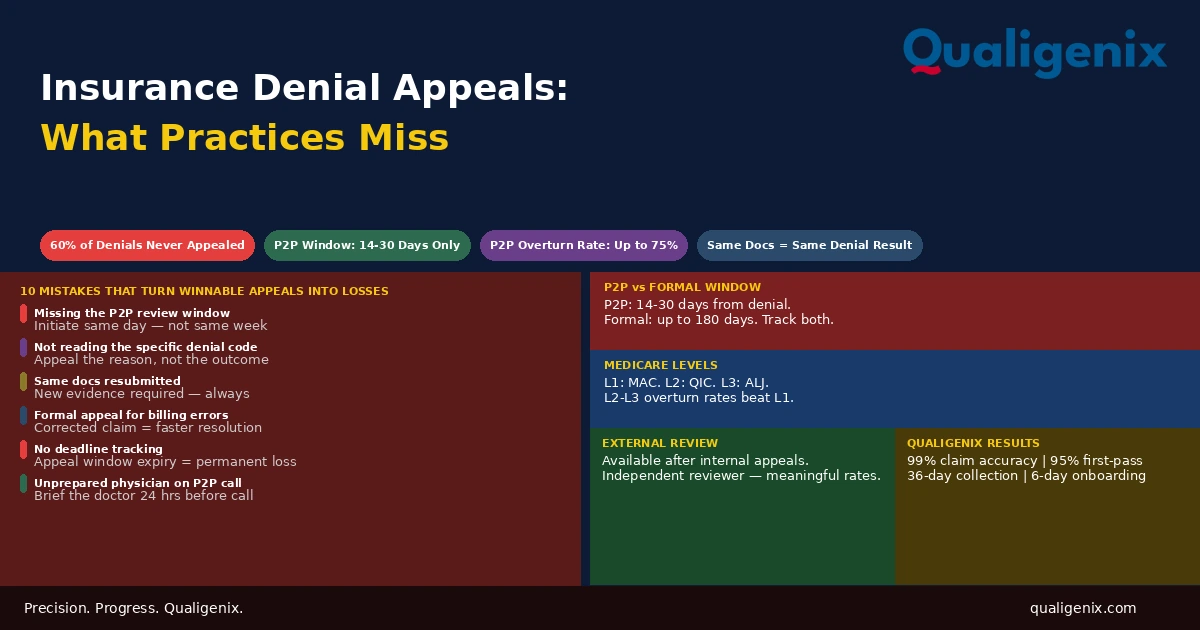
Insurance Denial Appeals: What Practices Miss
Most insurance denial appeals that fail don’t fail because the clinical case was weak. They fail because the...